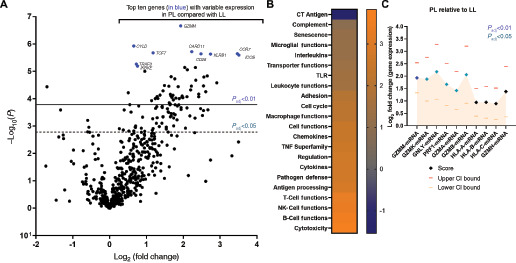
FIGURE 3.

A, Volcano plot among all cohort samples showing the log2 fold change in mRNA expression at the individual protein level plotted against adjusted −log10P value (degree of significance) among proliferative leukoplakia (PL) samples compared with localized leukoplakia (LL) samples. The top 10 genes with variable expression at higher significance are identified in blue and identified by name. *, P < 0.05; adjusted using the Benjamini–Yekutieli procedure (false discovery rate). B, Heat map of global significance scores compared among proliferative leukoplakia and localized leukoplakia (lighter color means higher positive scores) among genes/mRNA organized by immunologic function or pathway. C, Log2 fold change in mRNA expression scores among cytotoxicity genes in the immune panel among proliferative leukoplakia relative to localized leukoplakia samples. Upper and lower CI values are shown. *, P < 0.05 (adjusted) denoted by colored diamonds.
