
Fig. 2.
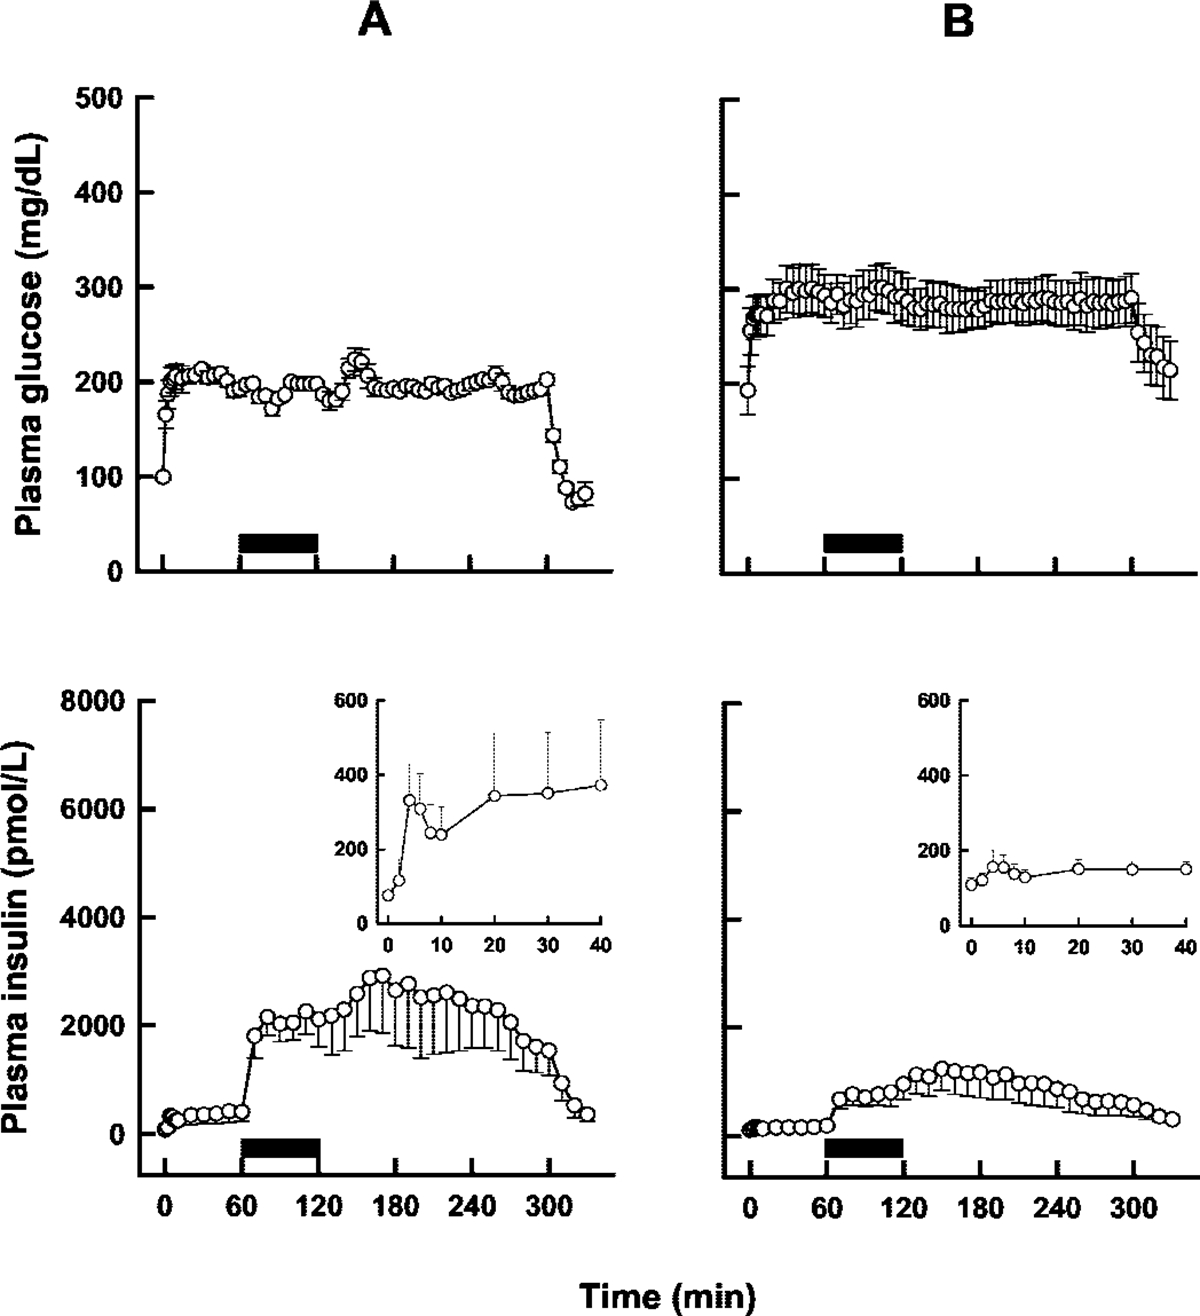
Mean plasma glucose (top panels) and insulin (bottom) concentrations after a hyperglycemic clamp (0–300 min) and an exendin-4 infusion (solid bars; 60–120 min) in nondiabetic (A) and type 2 diabetic (B) subjects. The insets in the bottom panels show first-phase insulin release on an adjusted scale. Error bars represent standard error (n = 7). Adapted from Egan et al. (2002).