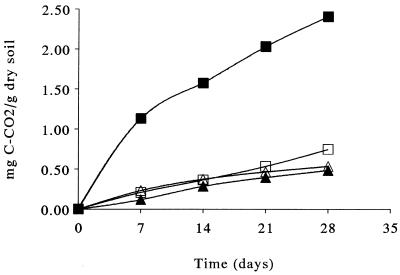
FIG. 1.
Cumulative CO2 evolution during incubation of polluted soil amended with 300 μg of NH4+ N/g (dry weight) of soil (▵), 4,000 μg of diesel fuel/g (dry weight) of soil (□), or 300 μg of NH4+ N/g (dry weight) of soil plus 4,000 μg of diesel fuel/g (dry weight) of soil (■) and unamended polluted soil (▴). Data are averages based on three replicates; the error bars are smaller than the symbols.

