
FIGURE 3.
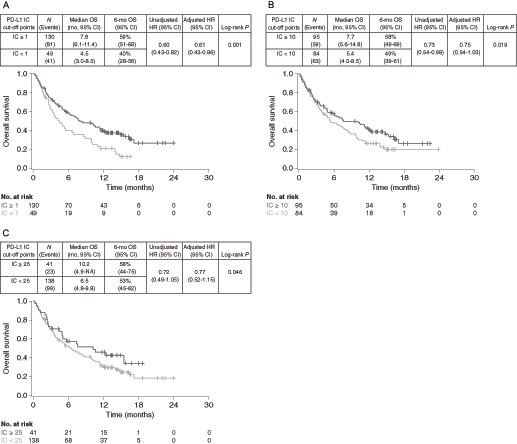
OS in PD-L1–high versus PD-L1–low/negative durvalumab-treated patients at different IC-based cut-off points. Kaplan–Meier plots of OS for cut-off points of IC1% (A), IC10% (B), and IC25% (C). IC, immune cell; NA, not available; OS, overall survival; PD-L1, programmed cell death ligand-1.