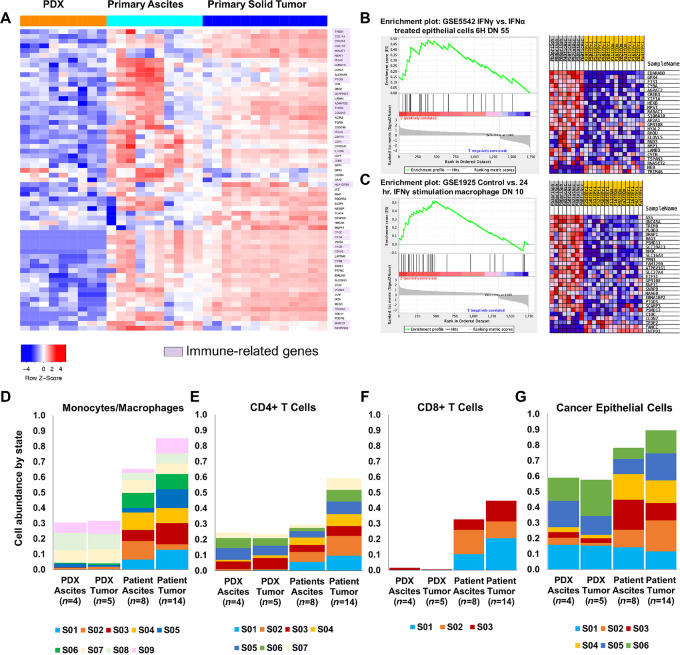
FIGURE 1.
Analysis of RNA-seq data comparing ovarian cancer patient samples to non-huPDX samples highlights the importance of immune cells in the patient samples. A, Of the differentially expressed genes that show significantly lower expression in non-huPDX samples (orange) compared with primary ovarian cancer ascites cells and primary ovarian cancer tumor samples, 43% are immune-related genes (highlighted in purple). A list of the differentially expressed genes (left) can also be found in Supplementary Table S3. B and C, GSEA comparing primary ascites (n = 8) and primary tumors (n = 14) shows enrichment in genes associated with IFNγ stimulation in primary ascites. D–G, Deconvolution analysis of the ovarian cancer RNA-seq dataset using Carcinoma Ecotyper to estimate the abundance of monocytes/macrophages (D), CD4+ T cells (E), CD8+ T cells (F), and cancer epithelial cells (G). Deconvolution can detect the absence of immune cells in the PDX samples. Note that certain predicted states (S) may not be specific to immune cells since they are abundant in the immunocompromised non-huPDX samples (e.g., monocyte/macrophage states S07–S09 and CD4+ T-cell states S03, S05, and S06). G, The relative abundance of epithelial states is also altered in the non-huPDX with a significant reduction in states S02–S04 based on an unpaired t test (P < 0.0001, P < 0.009, P < 0.005, respectively).

