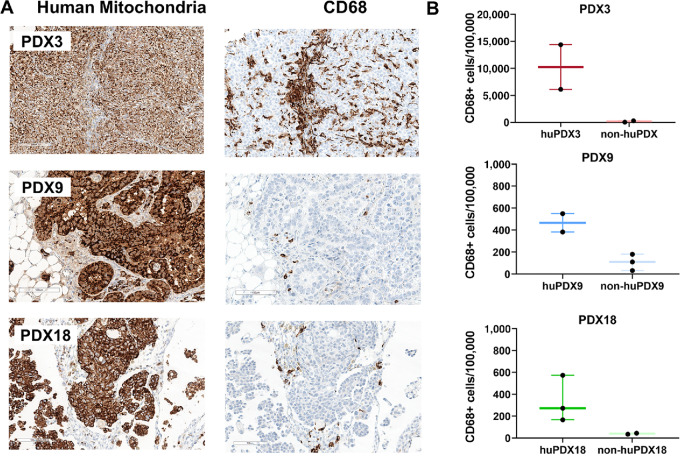
FIGURE 4.
Detection of TAMs in huNBSGW PDX tumor sections. A, Serial sections of huNBSGW PDX tumor tissue were labeled with human-specific antibodies against a mitochondrial protein to label all human cells and the TAM marker CD68. Scale bar, 100 μm. B, Quantification of the number of TAMs using HALO software to identify CD68+ cells. Values are no. of positive cells/100,000 cells. The box plots indicate the mean, minimum, and maximum. Black dots indicate values for each tumor analyzed (n = 2–3).

