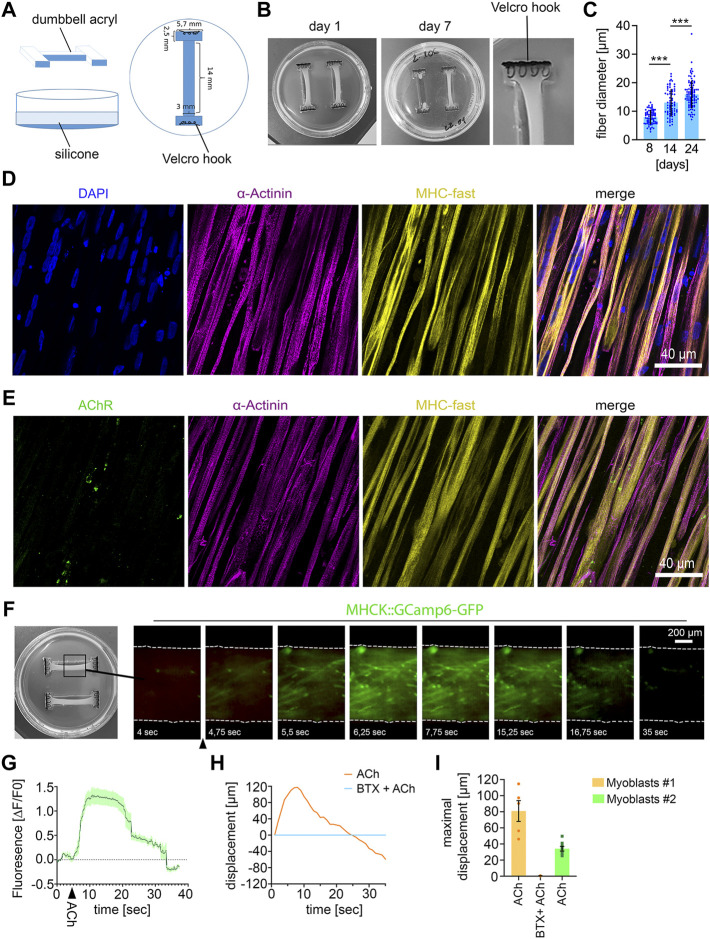
FIGURE 1.
Establishing 3D human muscle tissue (A) Scheme of dumbbell-shaped template for microfabrication of the 3D culture dish. (B) Macroscopic images of the human muscle tissue with 1500000 myoblasts at the indicated culture time. The use of too high cell numbers (2000000 cells) lead to tearing of muscle fiber tissue (muscle tissue on the right side in the middle image). (C) Quantification of muscle fiber diameter. 8 days, n = 72; 14 days, n = 70; 24 days, n = 85; Mean ± SEM; each data point represents the diameter of an individual muscle fiber. One-way ANOVA, Tukey’s multiple comparisons test. (D) Immunocytochemical stainings of 21 days-old muscle fiber tissue against α-Actinin, Myosin Heavy Chain (MHC)- fast and DAPI. Scale bar: 40 μm. (E) Immunocytochemical stainings of 21 days-old muscle fiber tissue against Acetylcholine Receptors (AChR), α-Actinin and MHC fast. Scale bar: 40 μm. (F) Time lapse images of a representative calcium transient. Arrowhead indicates timepoint of ACh stimulation. (G) Representative calcium transient upon ACh treatment, each data point represents the mean of six ROIs. Mean ± SEM. (H) Quantification of the muscle fiber contraction. A representative curve for the muscle tissue displacement upon ACh treatment and upon pretreatment with BTX, followed by ACh stimulation is shown. (I) Quantification of the maximal muscle fiber displacement. Each data point represents the maximal displacement of an individual muscle fiber tissue. Myoblasts #1: ACh, n = 5; BTX + ACh, n = 2. Myoblasts #2: ACh, n = 8.

