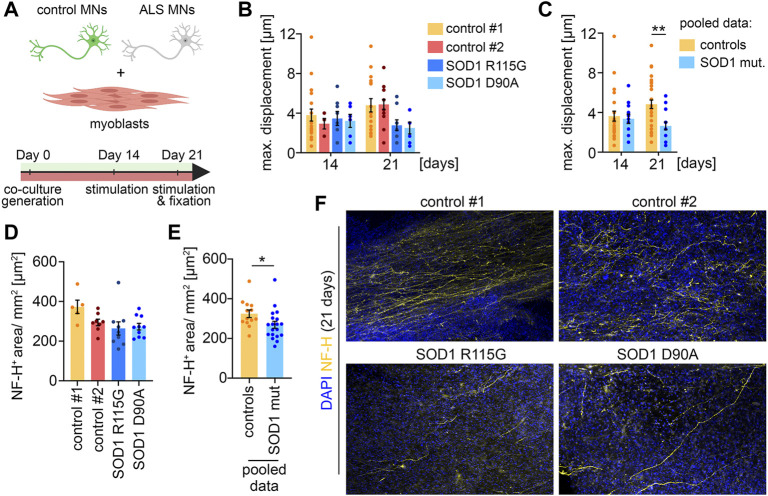
FIGURE 4.
ALS disease modeling (A) Scheme of the experimental setup. (B) Quantification of the maximal muscle fiber displacement. Co-cultures were stimulated with glutamate after 14 and 21 days in culture and the tissue movement was analyzed. Control#1: Day 14, n = 20; Day 21, n = 17. Control#2: Day 14, n = 5; Day 21, n = 15. SOD1 +/R115G : Day 14, n = 8; Day 21, n = 9. SOD1 D90A/D90A : Day 14, n = 6; Day 21, n = 8. (C) Pooled data of the quantifications shown in (B). Controls (control#1 & control#2): Day 14, n = 25; Day 21, n = 32. SOD1 mut. (SOD1 +/R115G & SOD1 D90A/D90A ): Day 14, n = 22; Day 21, n = 17. Two-tailed t-test. (D) Quantification of the axon outgrowth after 21 days. Control#1: n = 5. Control#2: n = 8. SOD1 +/R115G : n = 10. SOD1 D90A/D90A : n = 10. (E) Pooled data of the quantifications shown in (D). Controls (control#1 & control#2): n = 13. SOD1 mut. (SOD1 +/R115G & SOD1 D90A/D90A ): n = 20. Two-tailed t-test. (F) Representative low magnification images of co-cultures stained for NF-H and DAPI after 21 days.

