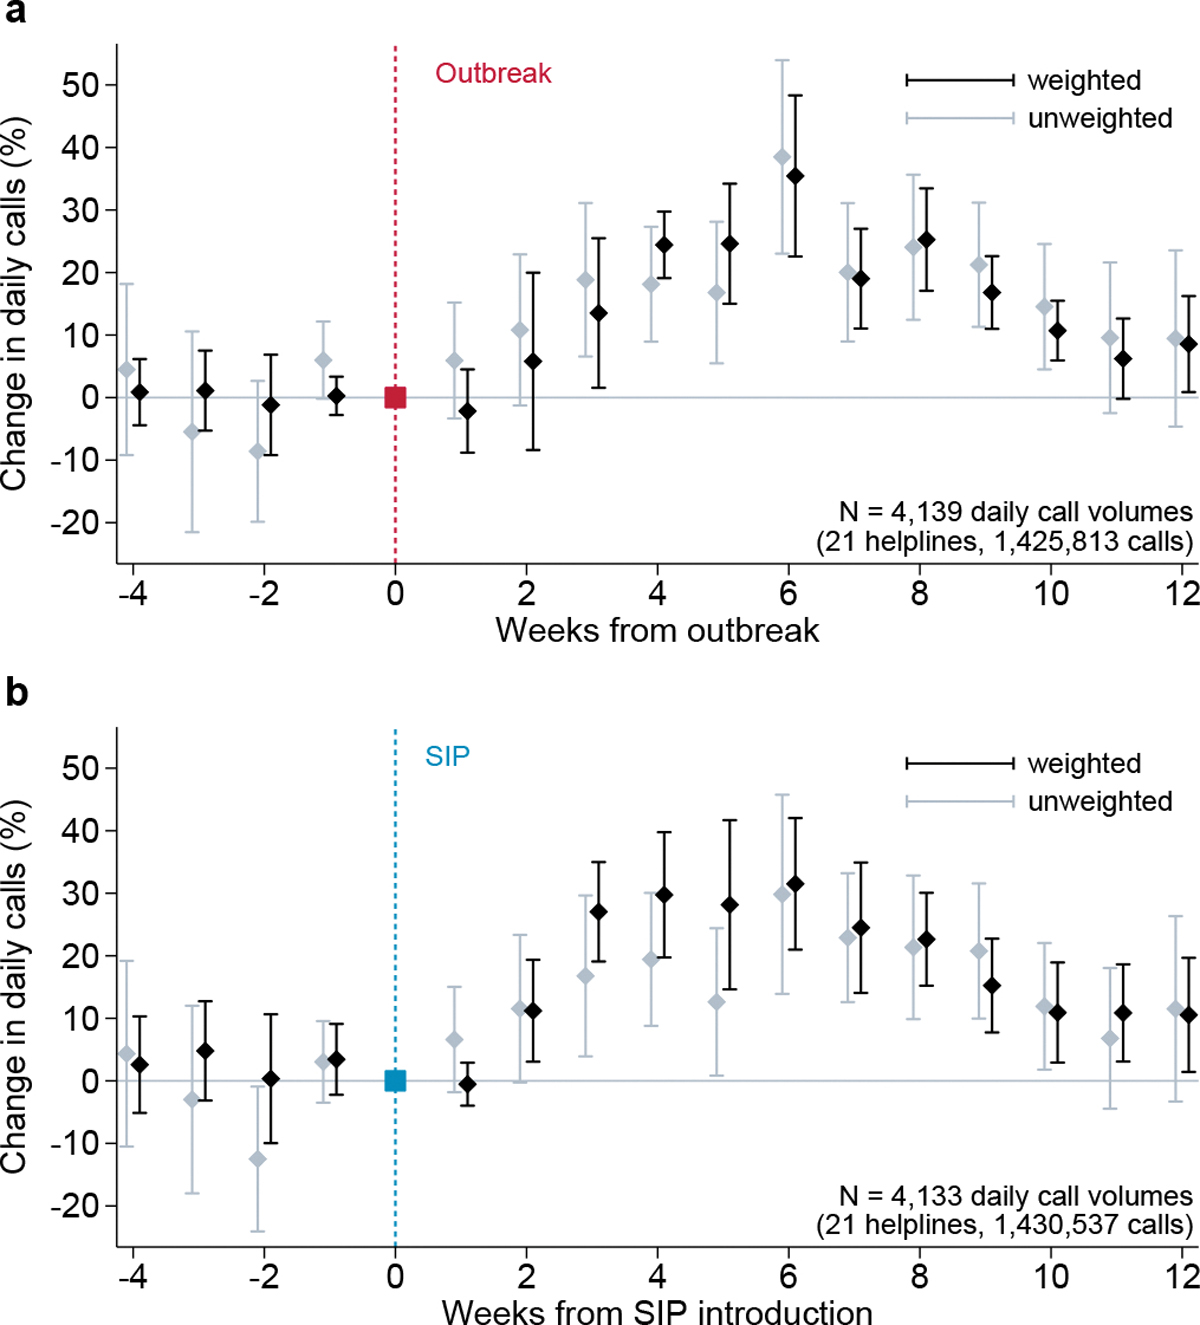
Fig. 1: Evolution of total helpline call numbers during the first wave.

Estimated coefficients on week indicators with 95% confidence intervals. The dependent variable is ln(helpline calls+1). The sample includes daily data for 21 helplines during the period from 4 weeks before to 12 weeks after the event date in early 2020, and, for 17 of the 21 helplines, the corresponding days of 2019. Average percentage change in call volumes relative to reference week 0. Week 0 is when, a, the cumulative number of SARS-CoV-2 infections exceeded 1 per 100,000 population39, or, b, shelter-in-place orders were introduced40. Results on data weighted by total number of calls recorded for each helpline during the sample period (black); and unweighted models (gray); see Methods, equation (1).
