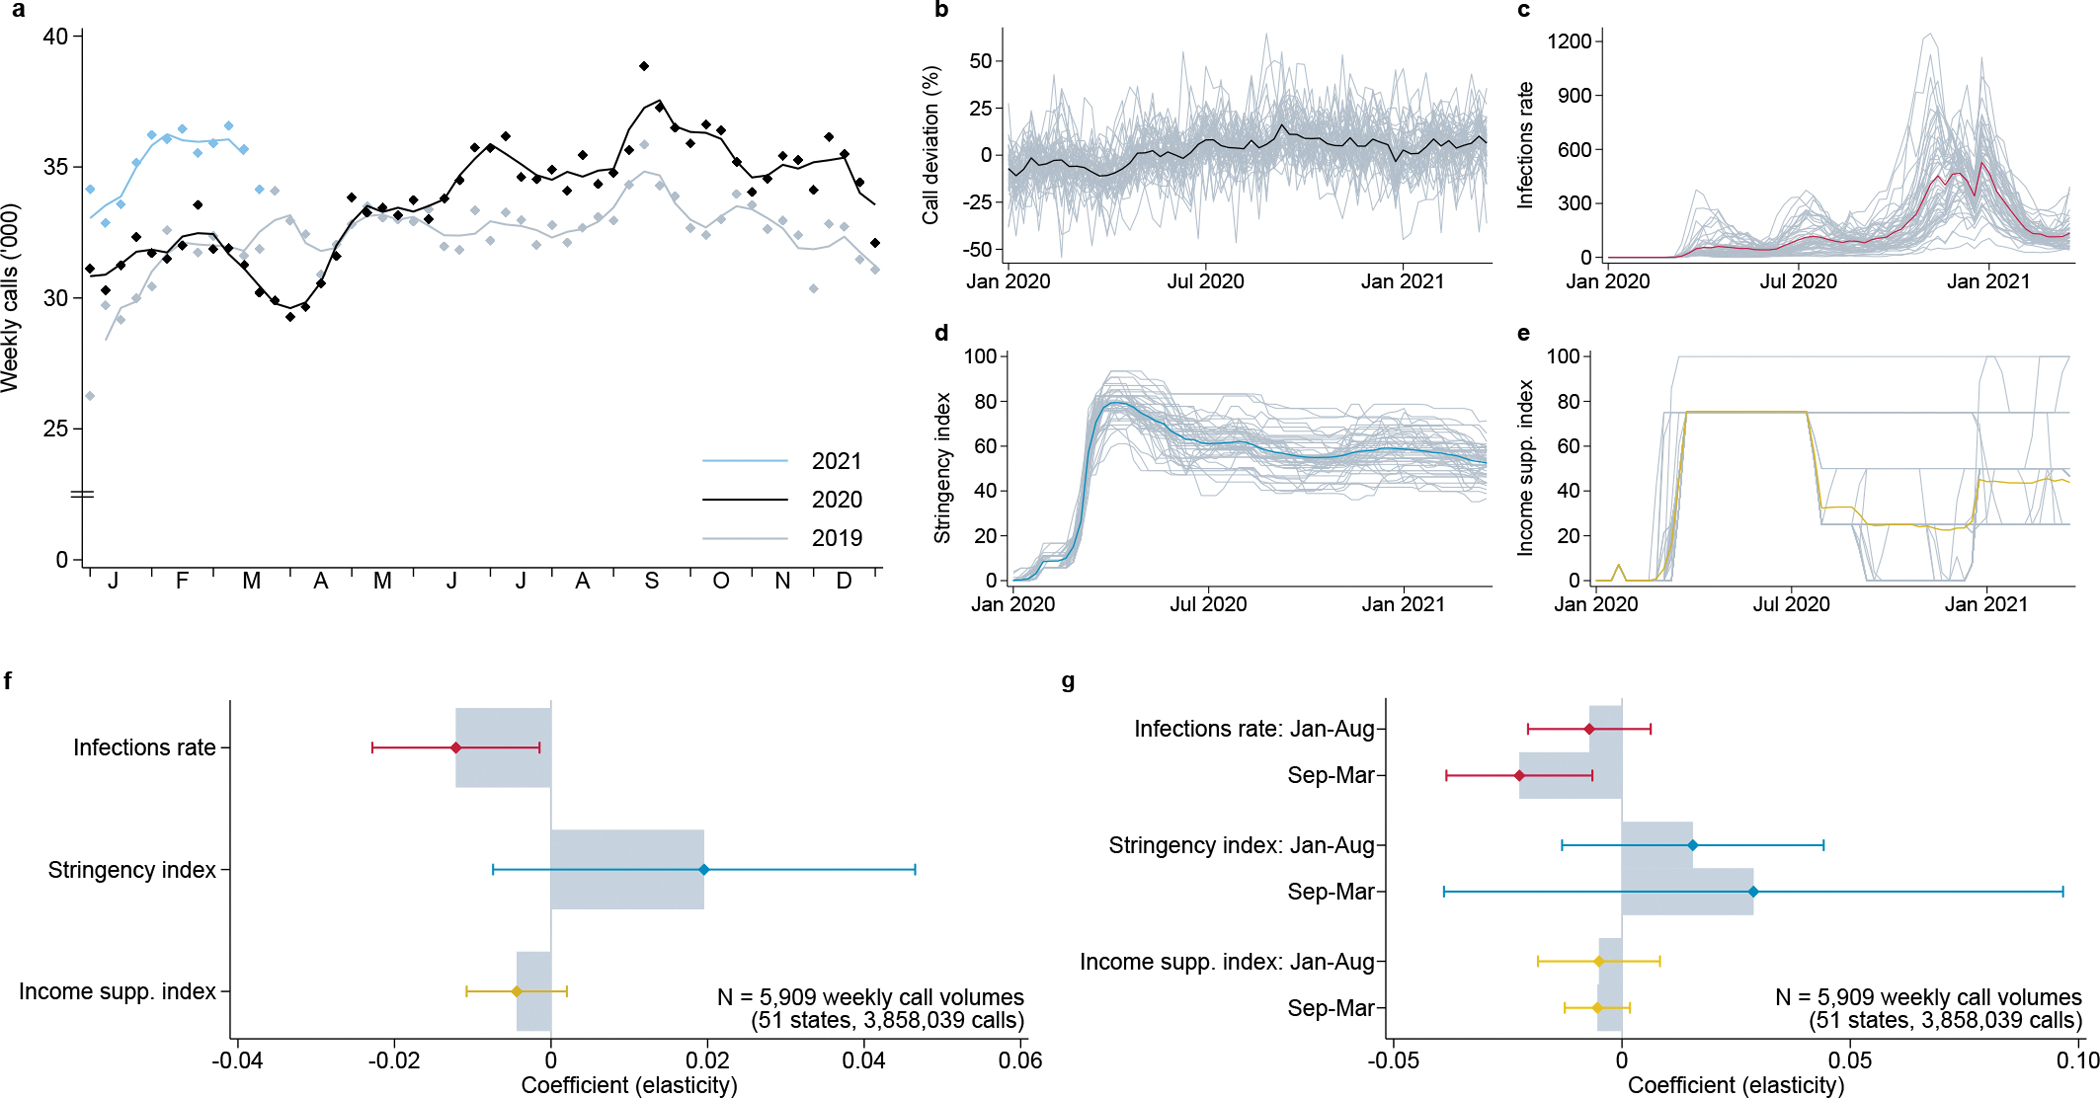
Fig. 4: Lifeline calls, COVID-19, and policy measures in the United States.

a, Overall sum of weekly calls routed to Lifeline centers by year, with 3-week moving average. b, Deviation of log calls from the state mean in gray, overall weekly average in black. Weekly average scores, with individual state values in gray, for c, newly confirmed SARS-CoV-2 infections per 100,000 population39, d, government response stringency index, and e, income support index40. f, Estimated coefficients and associated 95% confidence intervals. Sub-national panel model including state and week fixed effects. Dependent variable is ln(Lifeline calls+1), and independent variables are measured in logs as well; see Methods, equation (5). g, Coefficient estimates for interaction terms with indicators for the two periods from January–August 2020 and September 2020–March 2021, and associated 95% confidence intervals; see Methods, equation (6).
