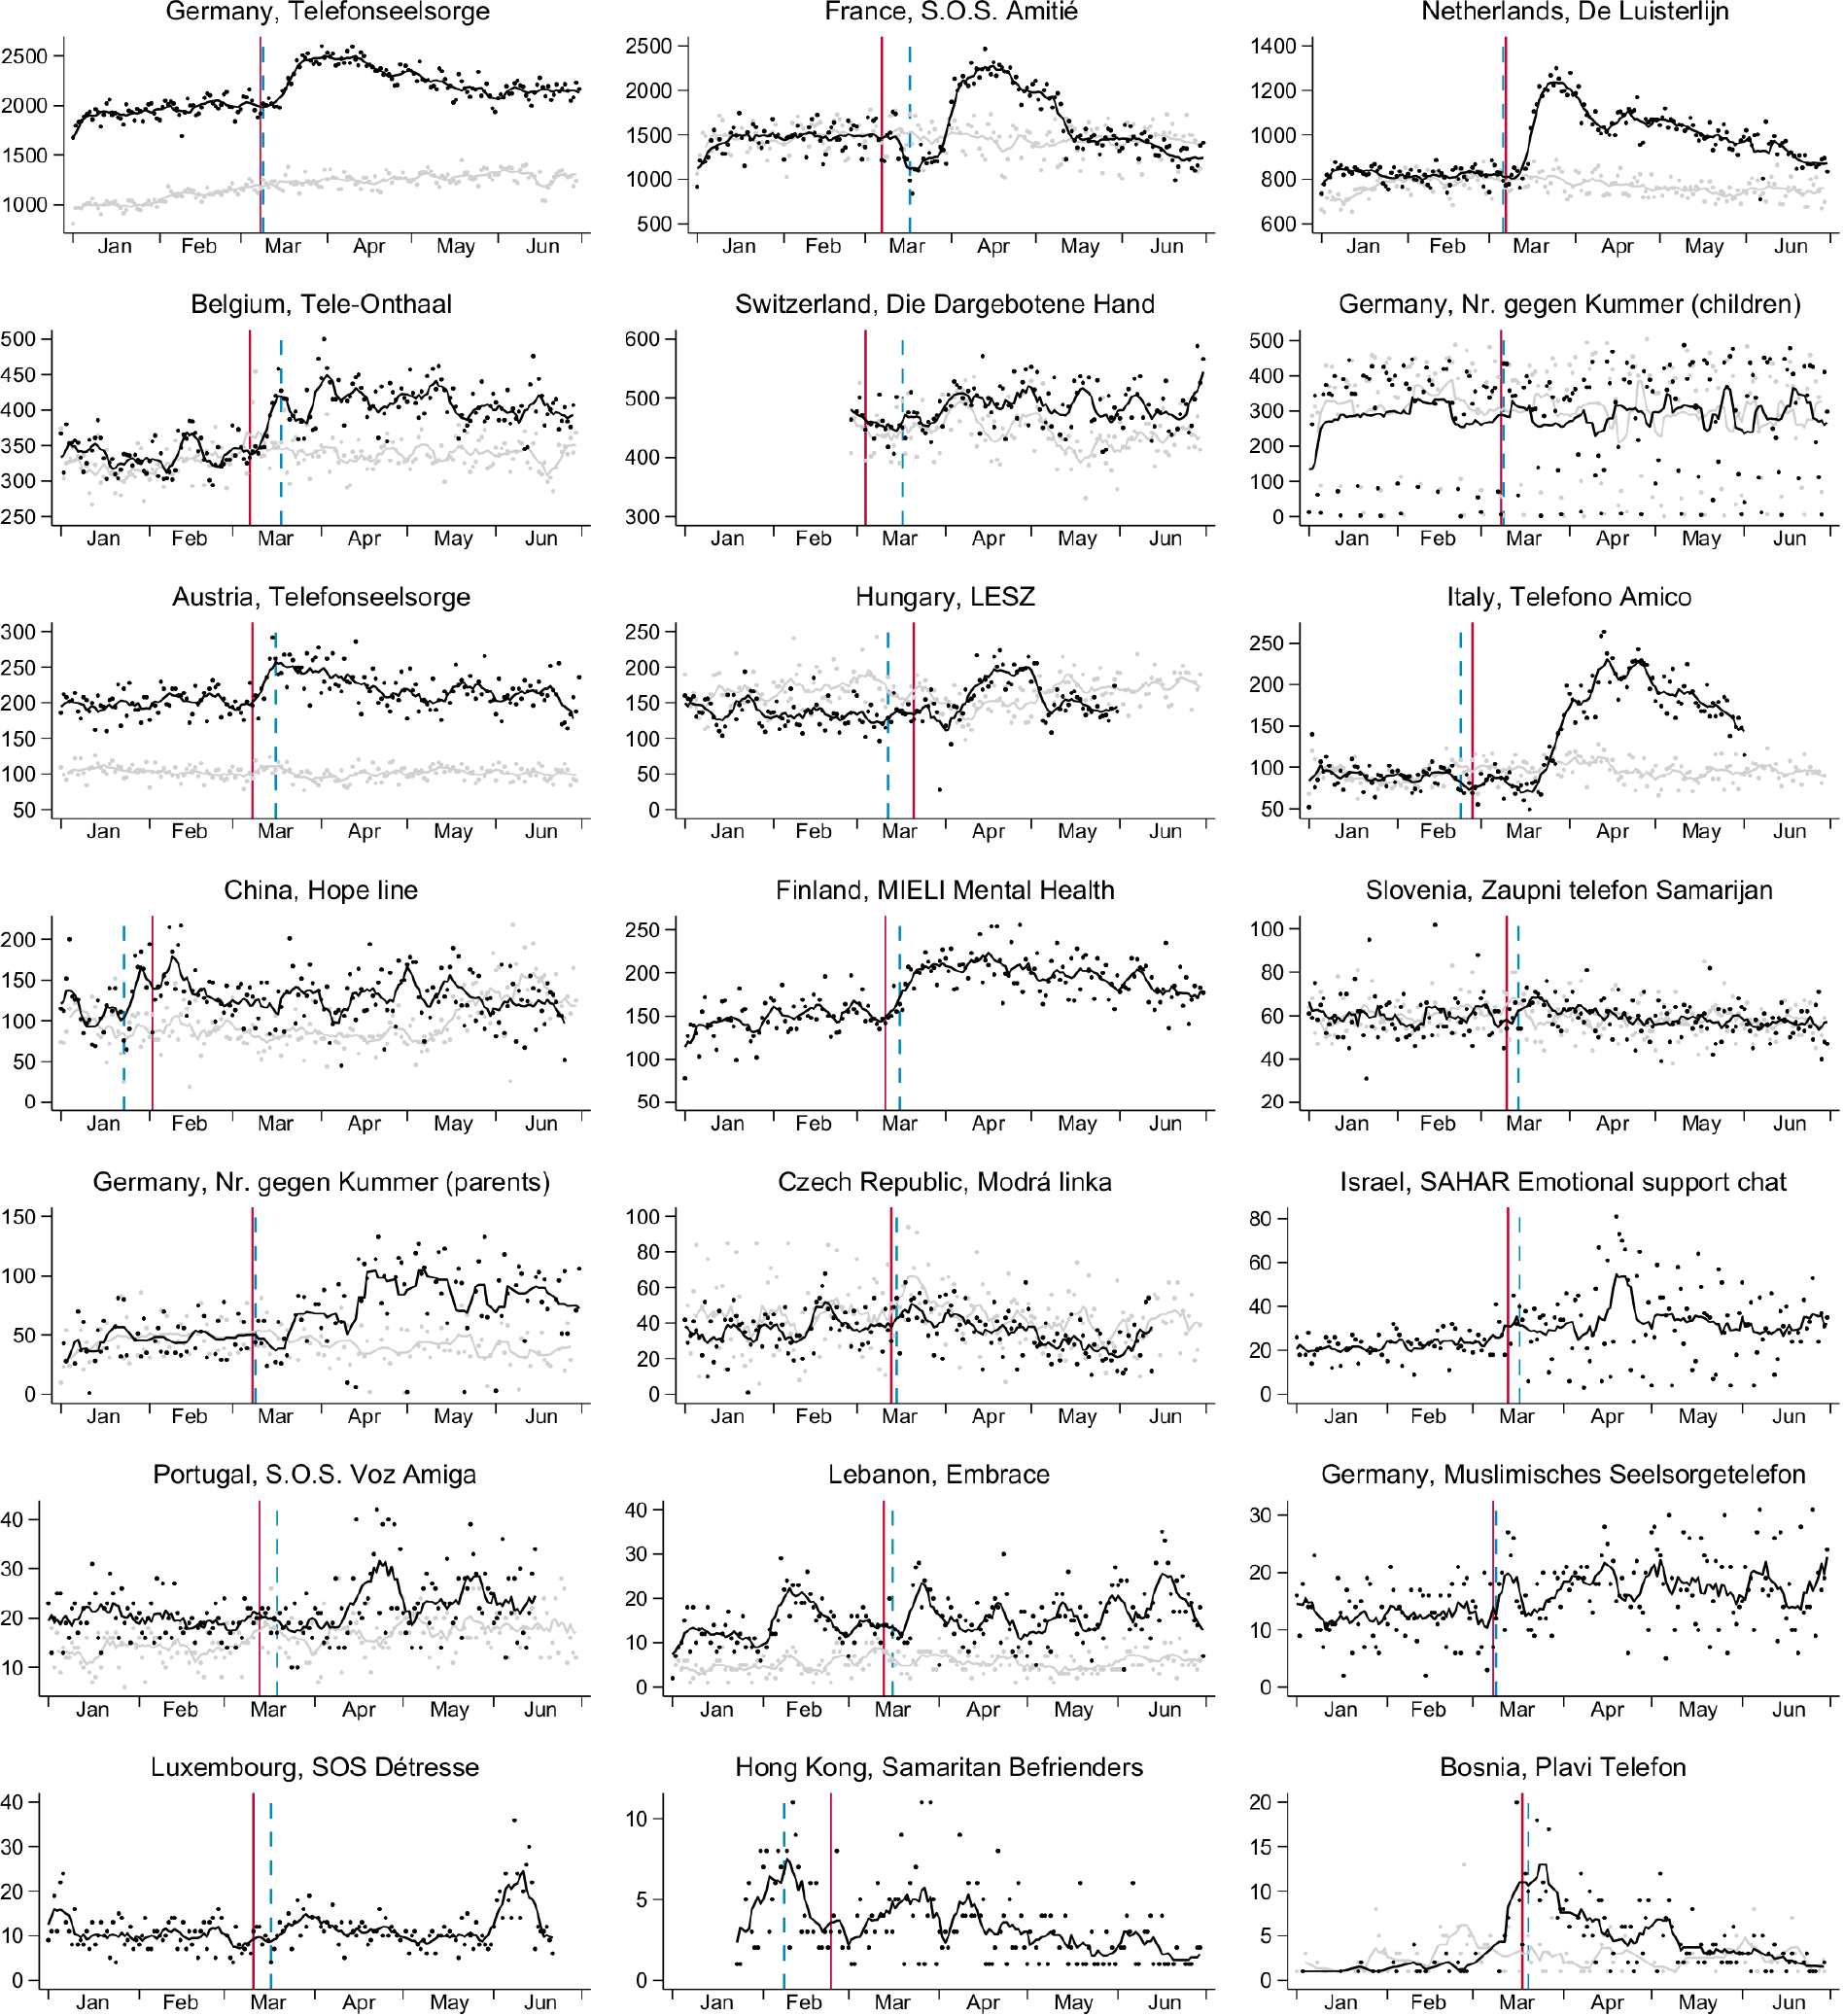
Extended Data Fig. 1: Evolution of daily helpline call volumes during the first wave.

Sum of daily helpline contacts with seven-day moving average, January–June 2020 (black) and 2019 (light grey, not available for all helplines). The solid red line shows the date of the pandemic outbreak, when more than 100 SARS-CoV-2 infections per 100,000 population have been recorded, the dashed blue line shows the date when shelter-in-place requirements were first introduced in the country of operation.
