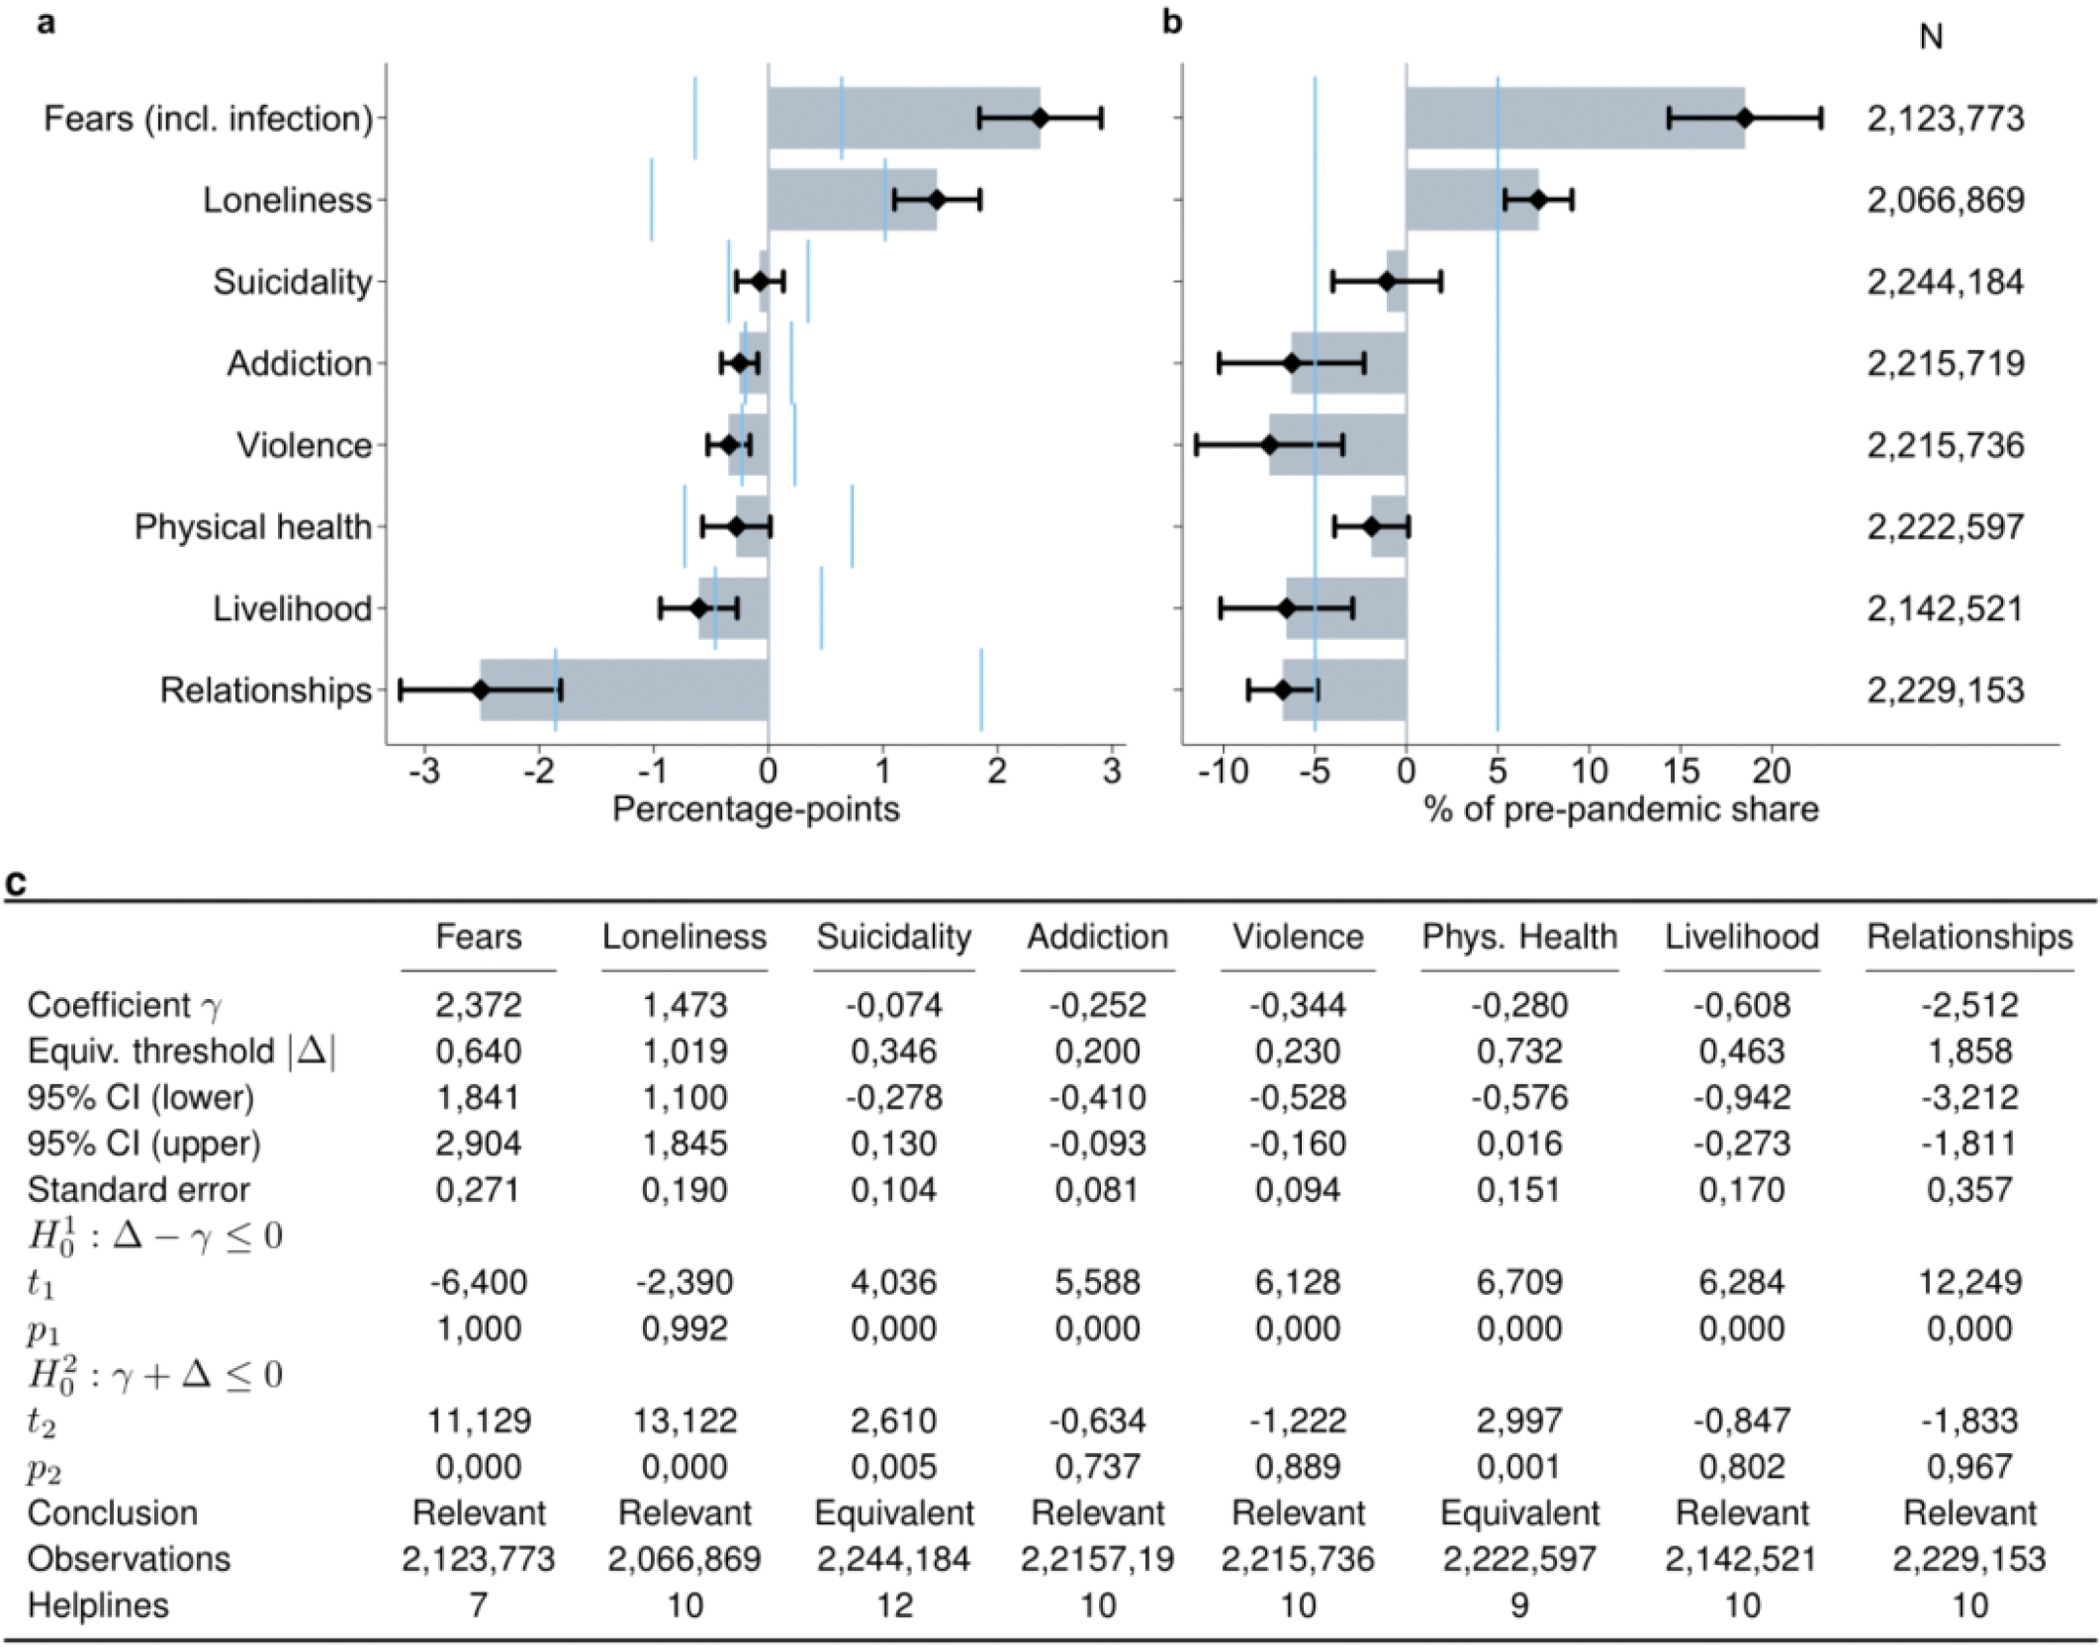
Extended Data Fig. 3: Magnitude of post-outbreak change and equivalence tests.

a, Coefficient estimates from linear probability models as in Fig.2b, with 95% confidence intervals and equivalence bounds, defined as 5% of the pre-pandemic share of the respective topic, indicated by light blue vertical bars. b, Results from a normalized across conversation topics, with coefficient estimates and associated 95% confidence intervals, and equivalence bounds divided by the pre-pandemic share of calls related to the respective topic. c, Relevance tests, numerical coefficient estimate with corresponding equivalence bounds, with test statistics and p-values from two one-sided tests for equivalence.
