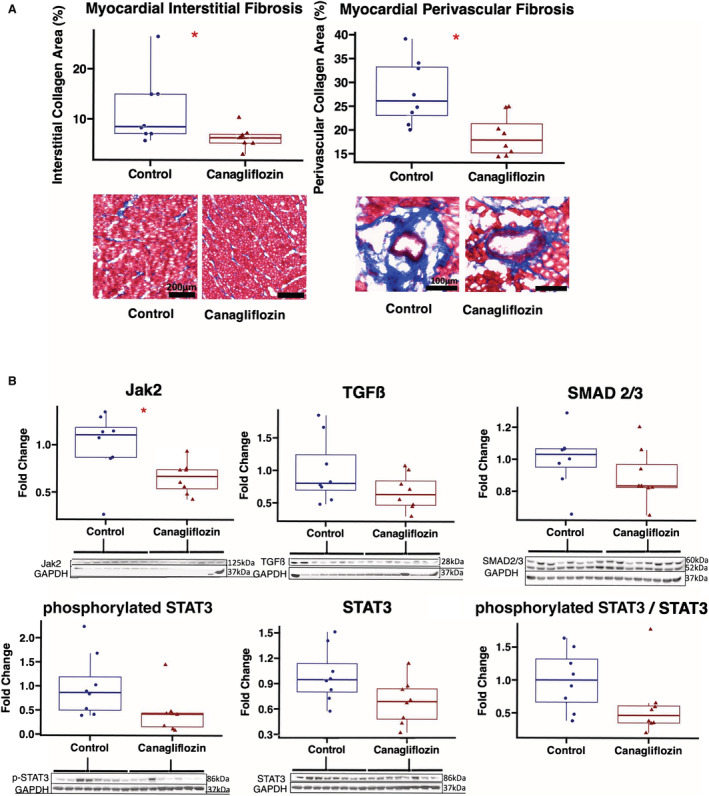
Figure 5. Canagliflozin therapy reduces myocardial interstitial and perivascular fibrosis in chronically ischemic myocardium with decreased Jak/STAT signaling.

A, Representative images of ischemic myocardial tissue with trichrome staining (20× magnification). Quantitative analyses of interstitial and perivascular fibrosis were carried out using QuPath software. Values expressed as fold change compared with average value in control group. B, Chronically ischemic myocardium in swine treated with canagliflozin (n=8) had decreased expression of Jak2, with strong trends toward decreased phosphorylated STAT3, and the ratio of phosphorylated STAT3/STAT3 compared with controls. There were nonsignificant trends toward decreased expression of STAT3, TGFβ, and SMAD2/3 in canagliflozin‐treated swine compared with controls (n=8). Values expressed as fold change compared with average value in control group. Upper and lower borders of box represent upper and lower quartiles, middle horizontal line represents median, upper and lower whiskers represent maximum and minimum values. *P<0.05, **P<0.01. Jak2 indicates Janus kinase 2; STAT3, signal transducer and activator of transcription 3; and TGFβ, transforming growth factor beta.
