
Figure 1. Forest plots of rates of permanent pacemaker implantation among treatment strategies (random‐effects model).
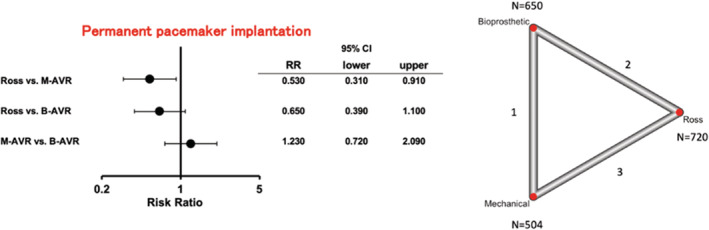
The horizontal lines represent the values within the 95% CI of the underlying effects. The vertical line indicates an incident risk ratio (RR) of 1. B‐AVR indicates bioprosthetic aortic valve replacement; and M‐AVR, mechanical aortic valve replacement.