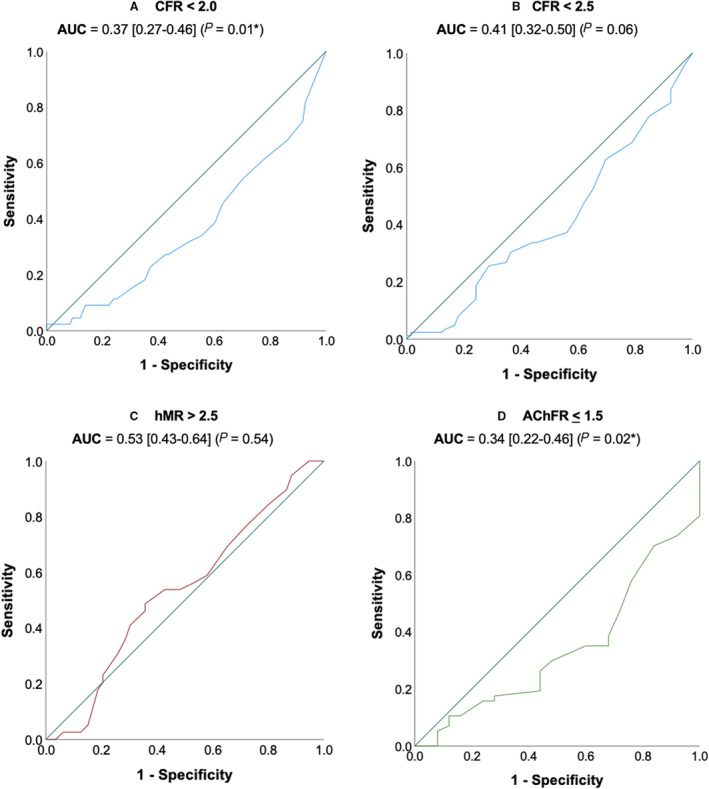
Figure 2. Receiver operating characteristic curve analysis.

Receiver operating characteristic curve analysis of higher corrected thrombolysis in myocardial infarction frame count to predict impaired coronary flow reserve (<2.0 or <2.5), (A and B), elevated hyperemic microvascular resistance (>2.5) (C) and impaired acetylcholine flow reserve (≤1.50) (D). Diagonal line represents area under the curve=0.5 (ie, no discriminatory ability). AChFR indicates acetylcholine flow reserve; AUC, area under the curve; CFR, coronary flow reserve; and hMR, hyperemic microvascular resistance.
