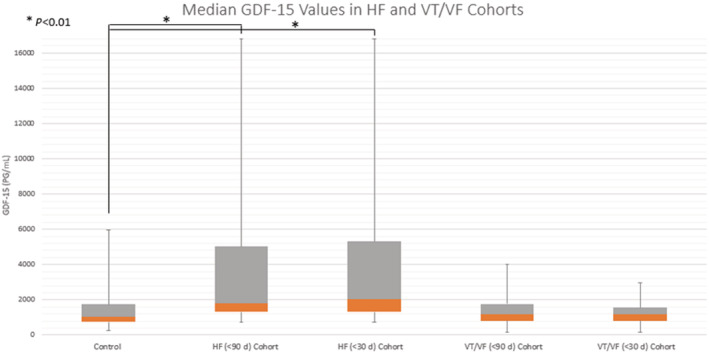
Figure 2. GDF‐15 (growth differentiation factor‐15) values (pg/mL) for heart failure and ventricular tachycardia/fibrillation subgroups at 90 days and 30 days before and after an event, as well as for the control group.

Median GDF‐15 values are shown, with the positive interquartile range shown in the gray box and negative interquartile range in orange. Maximum and minimum values for each group are represented by the whiskers. *P<0.01 from adjusted mixed model. GDF‐15 indicates growth differentiation factor‐15; HF, heart failure; and VT/VF, ventricular tachycardia/fibrillation.
