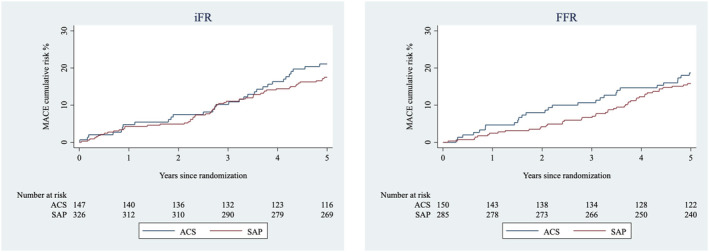
Figure 3. Kaplan‐Meier curve for the cumulative risk of a MACE by clinical presentation with respect to method.

The cumulative risk of major adverse cardiac event at 5 years relative to clinical presentation (SAP and ACS) deferred based on iFR (left) and FFR (right). ACS indicates acute coronary syndrome; FFR, fractional flow reserve; iFR, instantaneous wave‐free ratio; MACE, major adverse cardiac event; and SAP, stable angina pectoris.
