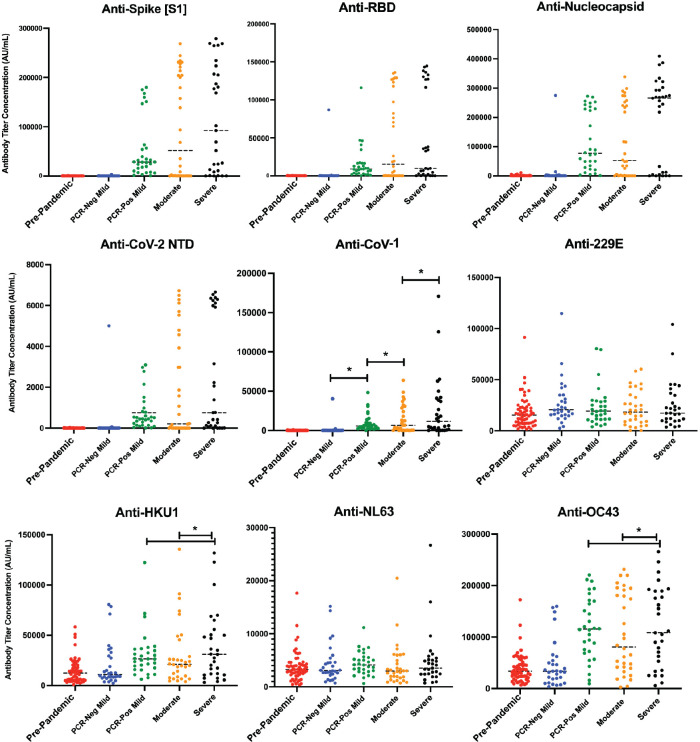
Figure 1.
Quantitative antibody response by disease severity. Dot plot representation of SARS-CoV-2 antibody concentration against spike (A), RBD (B), nucleocapsid (C), and N-terminal Domain of the nucleoprotein (NTD, D) across disease cohorts. Dot plot representation of samples for antibody cross-reactivity against the spike protein of SARS-CoV-1 (E), along with other alpha and beta coronaviruses (F-I) across disease severity. A static cutoff of 1000 AU/mL (anti-spike), 800 AU/mL (anti-RBD), and 5000 AU/mL (anti-N), depicted by the gray dashed line, was used to determine positive antibody response.
SARS-CoV-2 PCR-positive mild, moderate, and severe disease cohorts had increased antibody titers against CoV-1, with increasing antibody concentration by increased disease severity (P < 0.001). HKU1 and OC43 anti-S concentrations were statistically significantly increased in severe disease groups, compared to mild and moderate disease groups (P < 0.001). *: P < 0.001

