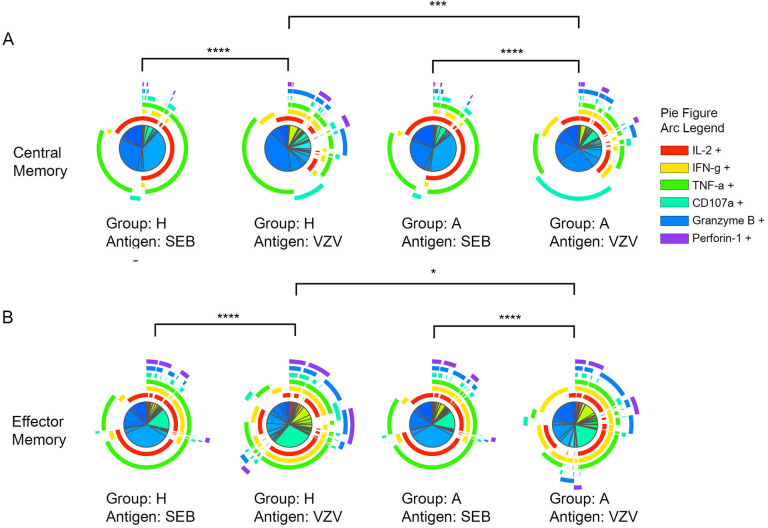
Figure 2.
Significant polyfunction differences of central and effector memory CD4+ T cells elicited by SEB or VZV in different groups of individuals. The pie charts represent different combinations of cytokine and effector molecule expression patterns of (A) central memory CD4+ T cells; (B) effector memory CD4+ T cells. The arcs are color coded for each effector function with the color legend noted. (*:P<0.05; **:P<0.01; ***:P<0.001) against SEB or VZV in acute HZ (A) and prior HZ (H) groups.

