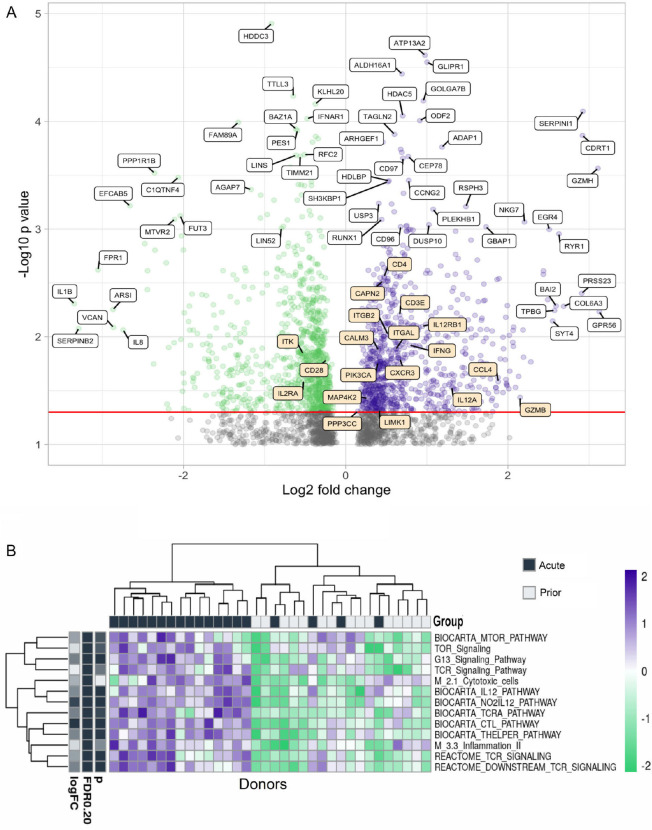
Figure 6.
Gene expression and pathway analysis of CD4+ memory T cells sorted from PBMCs from acute and prior individuals. (A) Volcano plot showing the differences in gene expression in memory CD4+ T cells in acute group donors vs prior group donors. Most significantly upregulated genes by P value and by log2-fold change are indicated with white labels, while genes from the BIOCARTA T-cell pathway are indicated in orange. This pathway includes the following: ‘BIOCARTA_CTL_PATHWAY’, ‘BIOCARTA_CTLA4_PATHWAY’, ‘BIOCARTA_MAL_PATHWAY’, ‘BIOCARTA_MEF2D_PATHWAY’, ‘BIOCARTA_NKT_PATHWAY’, and ‘BIOCARTA_TOB1_PATHWAY’. (B) Heatmap of different pathway activation patterns of CD4+ T cells from donors in acute group and prior group. Donors are clustered by pathway patterns. (*:P<0.05).

