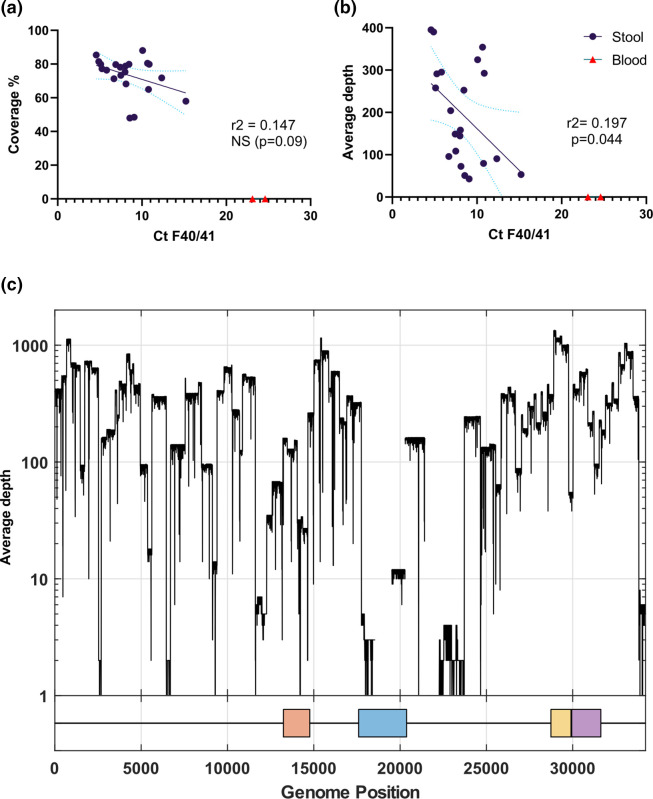
Fig. 3.
(a, b) Scatter plots showing (a) sample C t value versus per cent genome coverage; (b) sample C t value versus mean sequencing depth; in both cases, regressions exclude the samples extracted from blood that did not produce any HAdV-F reads. (c) The depth of coverage relative to the adenovirus F RefSeq (NC001454.1) for sample ERR9939847, a HAdV-F41 genome derived from a paediatric stool sample. The four capsid proteins are shown on the x-axis: penton (orange), hexon (blue), short fibre (yellow) and long fibre (purple).

