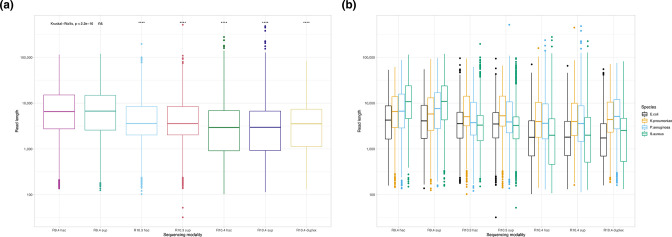
Fig. 2.
Read length distributions by (a) modality and (b) by modality and species. Boxplots reflect median (central line) and IQR (box hinges) values, whiskers the smallest and largest values 1.5*IQR, and dots the outlying points beyond these ranges. Note the y-axis is a log-scale. Median differences in read length were significant across the whole dataset (Kruskal-Wallis test, P<0.001); other significance values represent comparisons with the median read length for R9.4 hac as the reference category (two-sample Wilcoxon test, ‘ns’ - not significant, ‘****' - P<0.001). (a) Modality (b) Modality and species.

