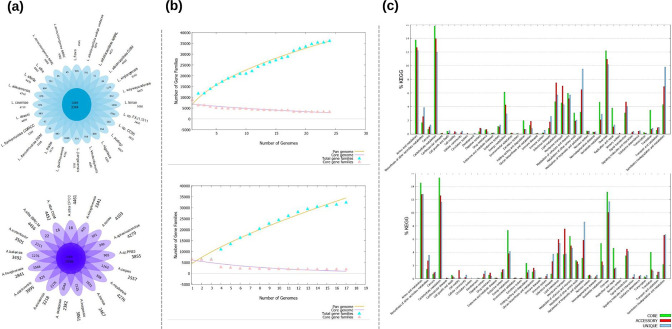
Fig. 2.
Pan-genome analysis for Lentzea and Actinokineospora genomes. (a) Flower diagrams representing the core, unique and accessory genes for each genus. The numbers underneath the names represent the number of accessory genes. (b) Core-/pan-genome plot over 500 iterations using the bpga analysis tool. The pan-genome is open. (c) KEGG functional analysis of the pan-genome. The graph shows the predicted function of proteins encoded by core (green), accessory (red) and unique (blue) genes of the pan-genome using KEGG identification.

