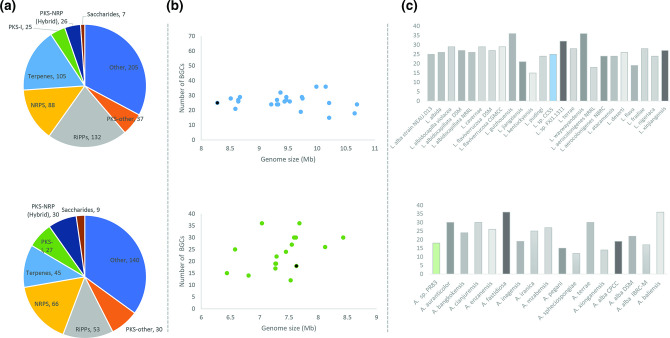
Fig. 4.
Distribution of BGCs according to antiSMASH identity. (a) Circular representation of BGC family distribution for Lentzea (circle at the top) and Actinokineospora (circle at the bottom). (b) Genome length versus number of clusters for Lentzea (blue; graph at the top) and Actinokineospora (green; graph at the bottom). Black circles represent Lentzea sp. CC55 and Actinokineospora sp. PR83, respectively. (c) Histogram for number of clusters by strain for Lentzea (blue; graph at the top) and Actinokineospora (green; graph at the bottom).

