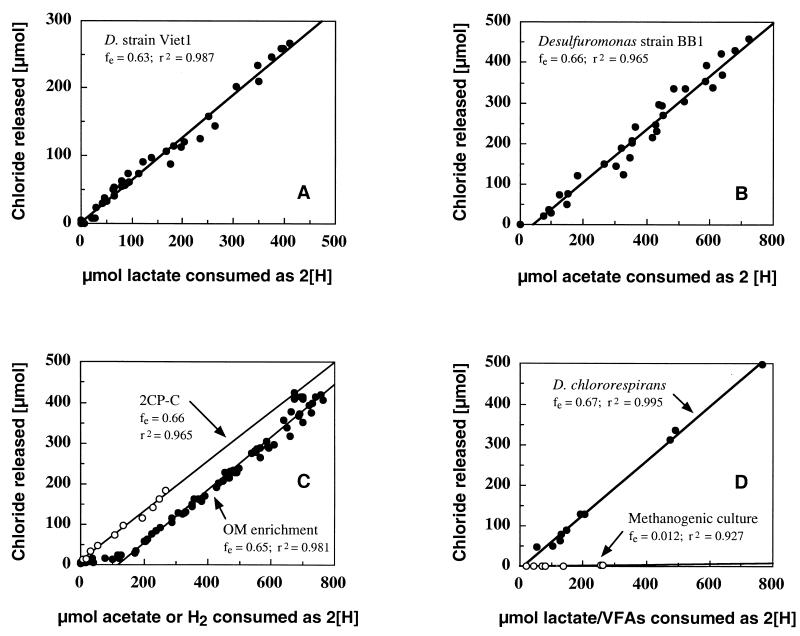
FIG. 2.
Graphical determination of fe values for dechlorinating cultures, in which the amounts of reducing equivalents (2[H]) generated during oxidation of the electron donor were plotted against the amounts of electron acceptor reduced. The fe is indicated by the slope of the regression line. (A) Desulfuromonas sp. strain BB1 (acetate plus PCE). (B) Desulfitobacterium sp. strain Viet1 (lactate plus PCE). (C) OM enrichment culture (H2 plus 2,5-DCP) and strain 2CP-C (acetate plus 2-CP). (D) Desulfitobacterium chlororespirans (lactate plus 3Cl-4-HBA) and methanogenic enrichment culture (VFA mixture and 3-CP).

