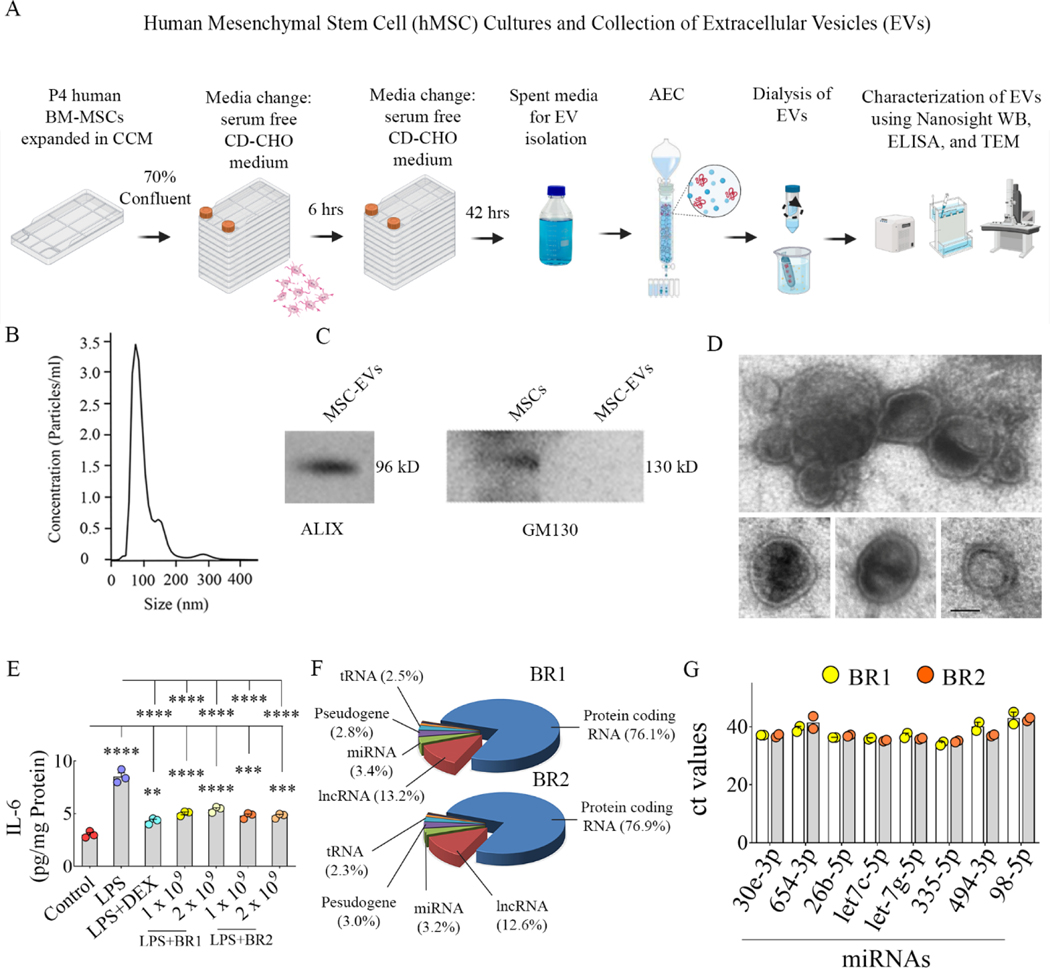
Figure 2: Human mesenchymal stem cells (hMSC) cultures and isolation and characterization of hMSC-derived extracellular vesicles (EVs) using various methods.
Cartoon A depicts the timelines employed for culturing hMSCs and collecting spent media, hMSC-EV isolation using anion-exchange chromatography (AEC), and characterization of hMSC-EVs using various methods. Graph B depicts the concentration and size of hMSC-EVs obtained through NanoSight analysis. The blots in C demonstrate the presence of EV-specific protein ALIX and the absence of the cytoplasmic protein GM130 in hMSC-EVs. The image in D displays the morphology and size of hMSC-EVs revealed through transmission electron microscopy. Scale bar, 50 nm. The bar chart in E demonstrates the robust antiinflammatory activity of hMSC-EVs on macrophages stimulated with lipopolysaccharide (LPS) compared to the dexamethasone (DEX) treatment. **, p<0.01; ***, p<0.001; ****, p<0.0001. The pie chart in F shows different fractions of small RNAs in hMSC-EVs identified through small RNA sequencing, and bar chart G illustrates the eight validated miRNAs.

