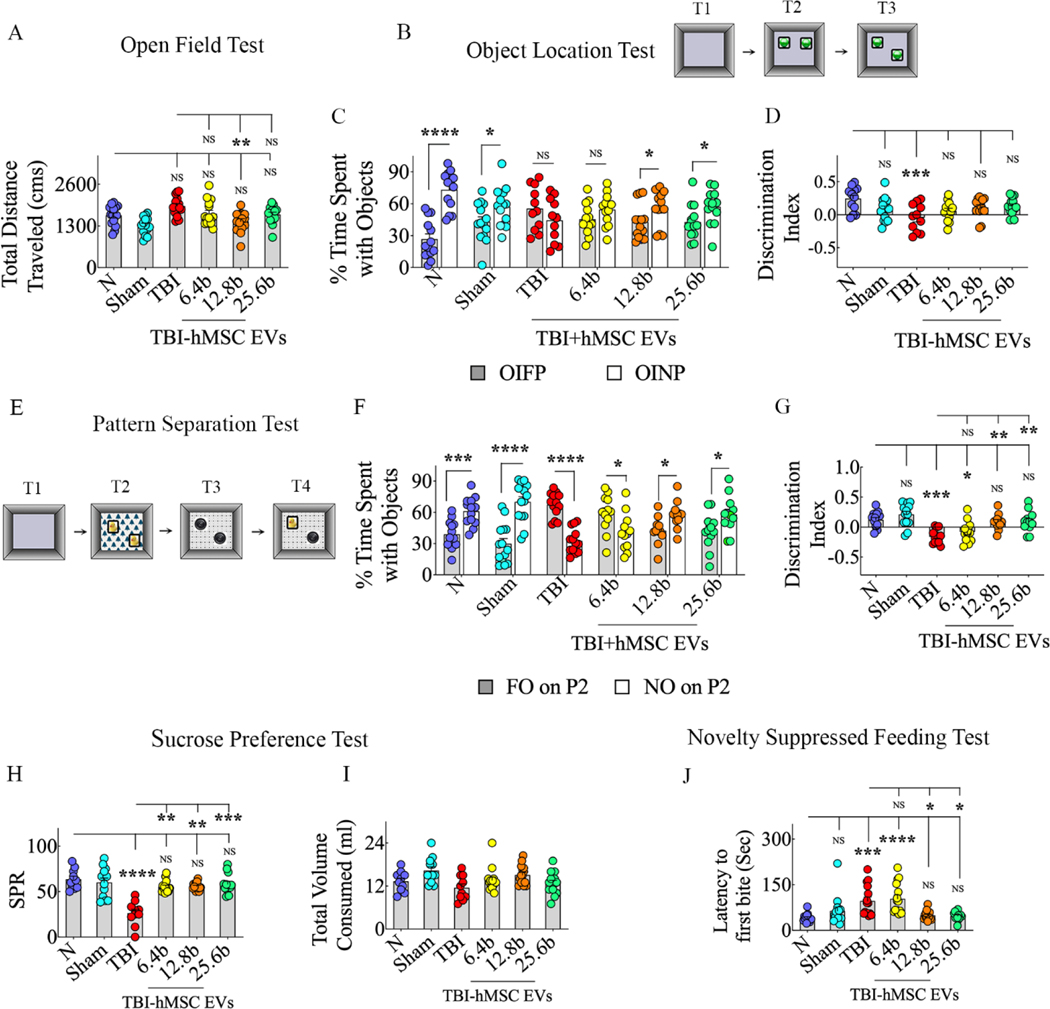
Figure 5: Intranasal hMSC-EV treatment after TBI prevented long-term cognitive and mood impairments.
Bar chart A compares total distances traveled in an open field test between naïve control, TBI, and different TBI+EV groups. Cartoon B depicts different trials (T1-T3) in an object location test. The bar charts in C compare percentages of object exploration times spent with the object in the familiar place (OIFP) vis-à-vis the object in the novel place (OINP) in naïve (N), sham surgery (Sham), TBI, and TBI+6.4, 12.8, or 25.6 × 10⁹ EV groups. Bar chart D compares the OINP discrimination index across different groups. Cartoon E depicts different trials (T1-T4) in a pattern separation test. The bar charts in F compare percentages of object exploration times spent with the familiar object on pattern 2 (FO on P2) vis-à-vis the novel object on P2 (NO on P2) in naïve (N), sham surgery (Sham), TBI, and TBI+6.4, 12.8, or 25.6 × 10⁹ EV groups. Bar chart G compares the NO on P2 discrimination index across different groups.
The bar charts H and I compare the sucrose preference rate (SPR, H) and total fluid consumption (I) across different groups. The bar chart J compares latencies to the first bite of food in a novelty-suppressed feeding test between different groups. *, p<0.05; **, p<0.01; ***, p<0.001; and ****, p<0.0001; NS, not significant.

