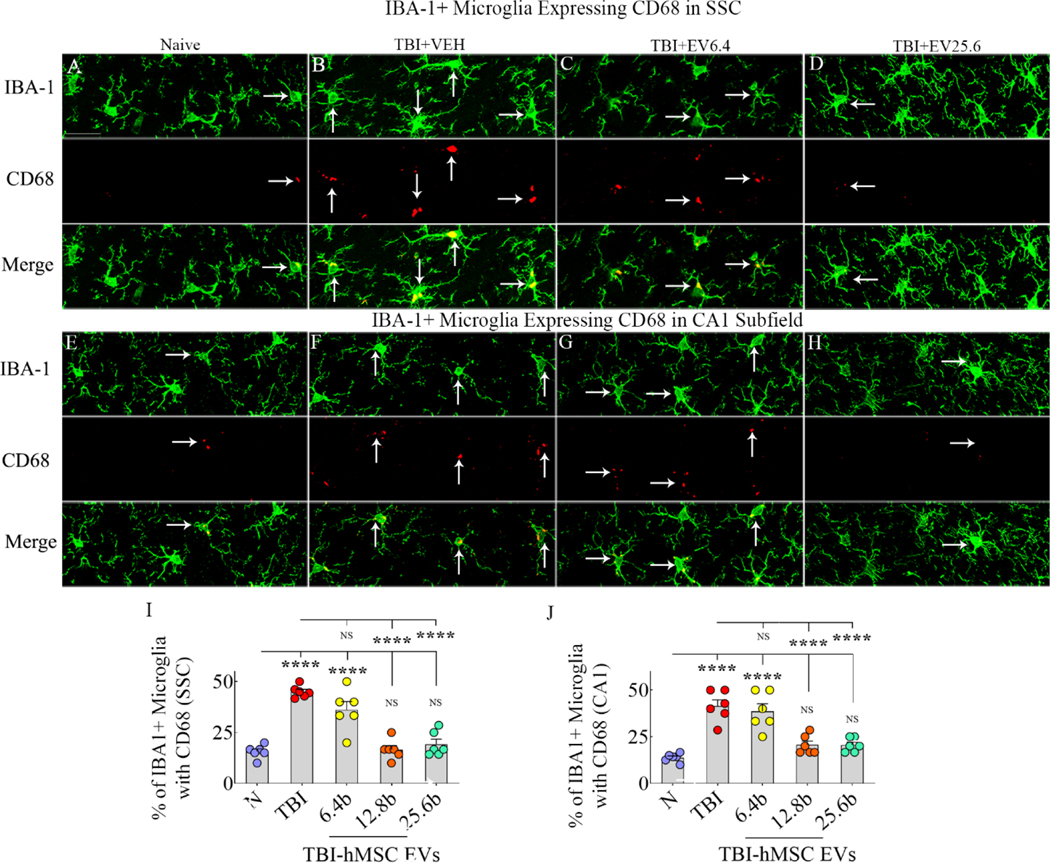
Figure 6: Intranasal hMSC-EV treatment after TBI led to a lower ratio of proinflammatory microglia in the chronic phase.
The image panels in A-H illustrate examples of IBA-1+ microglia (green) expressing CD68 (red) in the somatosensory cortex (SSC; A-D) and the hippocampal CA1 subfield (E-H). Panels A and E, naïve group; B and F, TBI group; C and G, TBI+6.4 × 10⁹ EVs group; D and H, TBI+25.6 × 10⁹ EVs group. The bar charts in I and J compare percentages of IBA-1+ microglia with CD68 in the SSC (I) and the hippocampal CA1 subfield (J) between different groups. Scale bar, A-H = 25 μm; ****, p<0.0001; NS, not significant.

