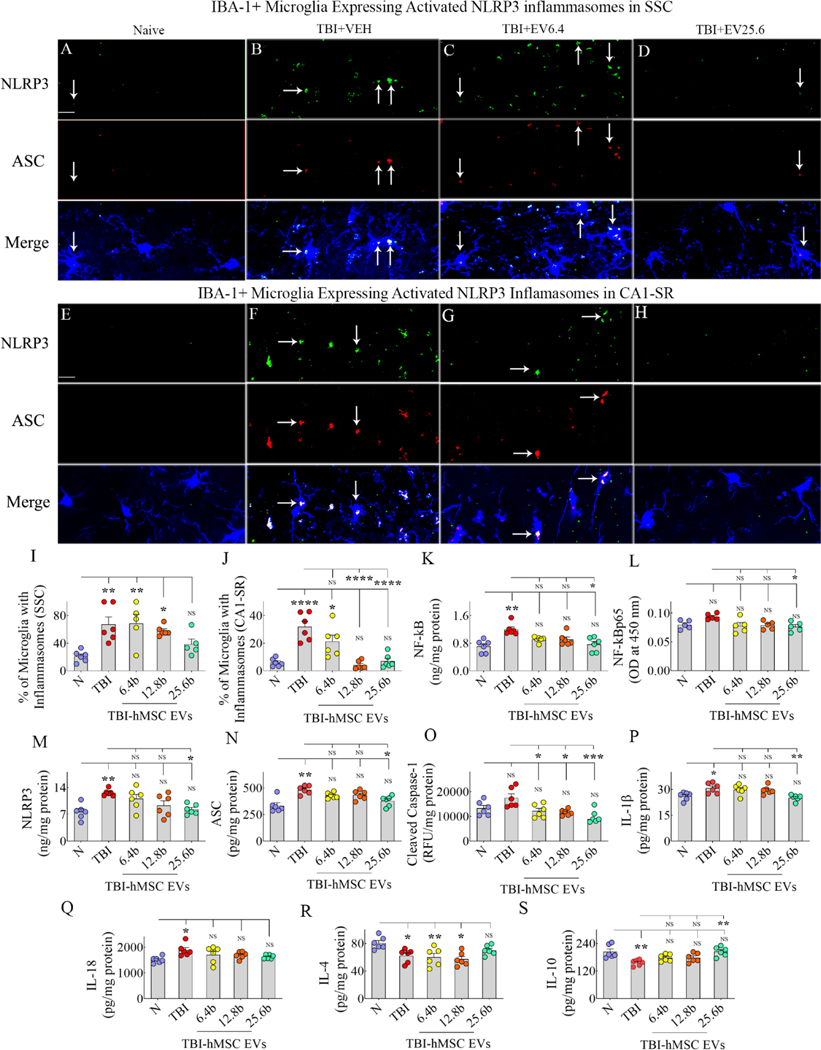
Figure 7: Intranasal hMSC-EV treatment after TBI blocked the chronic inflammasome activation in microglia and increased the concentration of antiinflammatory cytokines.
The image panels in A-H illustrate examples of nucleotide-binding domain leucine-rich repeat and pyrin domain-containing receptor 3 (NLRP3) inflammasome complexes co-expressing NLRP3 (green) and apoptosis-associated speck-like protein containing a CARD (ASC, red) in IBA-1+ microglia from the somatosensory cortex (SSC; A-D) and the CA1 stratum radiatum (E-H). Panels A and E, naïve group; B and F, TBI group; C and G, TBI+6.4 × 10⁹ EVs group; D and H, TBI+25.6 × 10⁹ EVs group. The bar charts I-J compare the percentages of microglia with inflammasomes in the SSC (I) and CA1 subfield (J) between different groups. The bar charts K-O compare concentrations of the NF-kB (K), NF-kB p65 (L), NLRP3 (M), ASC (N), and cleaved caspase-1 (O) between different groups. The bar charts P-Q compare the levels of end products of NLRP3 inflammasomes interleukin-1 beta (IL-1β; P) and IL-18 (Q), whereas the bar charts R-S compare the concentration of antiinflammatory cytokines IL-4 (R) and IL-10 (S) between different groups. Scale bar, A-H = 25 μm; *, p<0.05; **, p<0.01; ***, p<0.001; ****, p<0.0001; NS, not significant.

