Fig. 1.
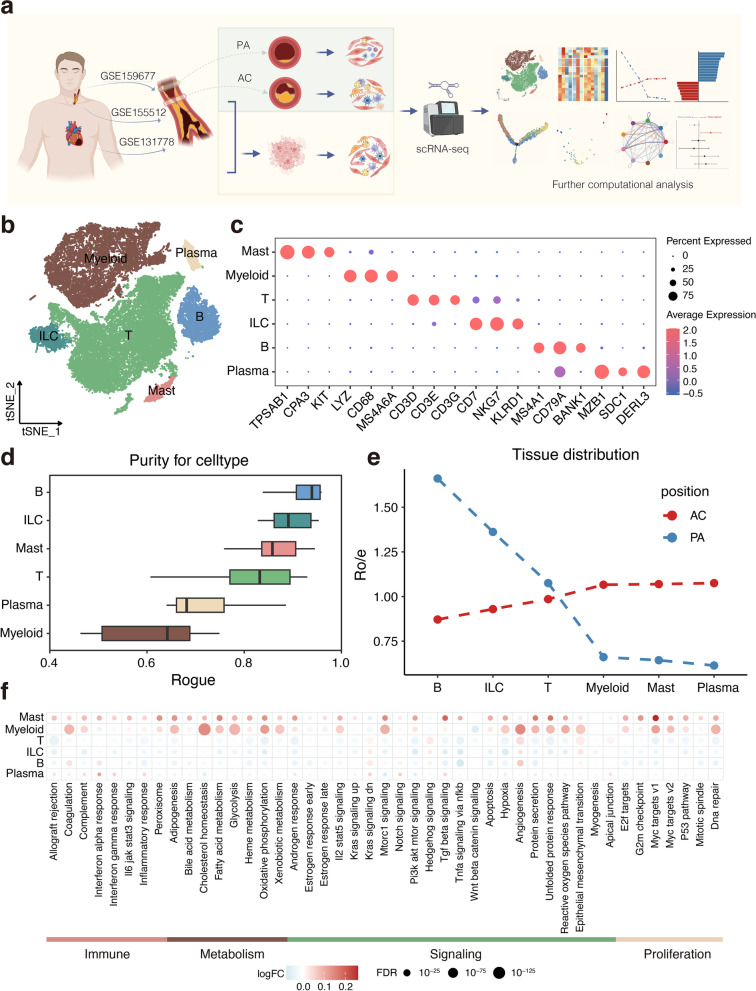
Dissection of the immune landscape in atherosclerosis with scRNA-seq. a Schematic of the overall study design. AC, atherosclerotic core; PA, adjacent portion. b t-SNE plots showing 44,120 immune cells from atherosclerosis lesions. ILC, Innate lymphoid cells. c Dot plot showing average expression of known markers in indicated immune cell types. d Boxplot showing cell purity for each cell type by ROGUE. e Line chart showing tissue prevalence for each cell type estimated by Ro/e score. f Dot plots showing differentially enriched pathways in the global cell type between AC and PA tissues

