Fig. 5.
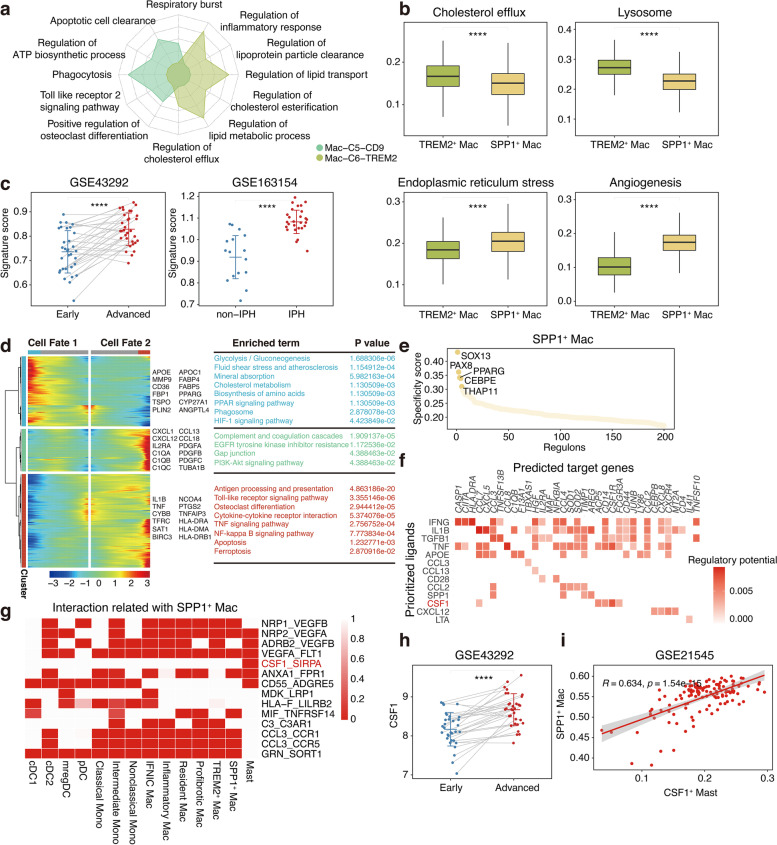
Characterisation of a novel dysfunctional foam macrophage population. a Radar plot showing enrichment of GO term for TREM2-related top 30 genes in C5 and C6 macrophage populations. b Boxplots showing phenotypic scores of TREM2+ Mac and SPP1+ Mac. ****, P ≤ 0.0001. Wilcoxon rank sum test. c Boxplots showing infiltrating score of SPP1+ Mac in paired early (n = 32) and advanced (n = 32) lesions (left) and non-IPH (n = 16) and IPH (n = 27) lesions. non-IPH, non-intraplaque haemorrhage; IPH, intraplaque haemorrhage. ****, P ≤ 0.0001. Wilcoxon rank sum test. d Heatmap showing different blocks of DEGs along the pseudotime trajectory (left). Selected KEGG pathways related to corresponding DEGs in heatmap (right). e Scatter plot showing the specificity scores of regulons of SPP1+ Mac. The top 5 regulons are highlighted. f Heatmap showing potential ligands driving the phenotype of SPP1+ Mac. g Heatmap showing the selected ligand-receptor pairs between SPP1+ Mac and other cells in lesions. h Boxplots showing CSF1 expression levels in paired early (n = 32) and advanced (n = 32) lesions. ****, P ≤ 0.0001. Paired Student’s t test. i Scatter plot showing the Pearson correlation of the proportion of CSF1+ mast cells and SPP1+ Mac cells

