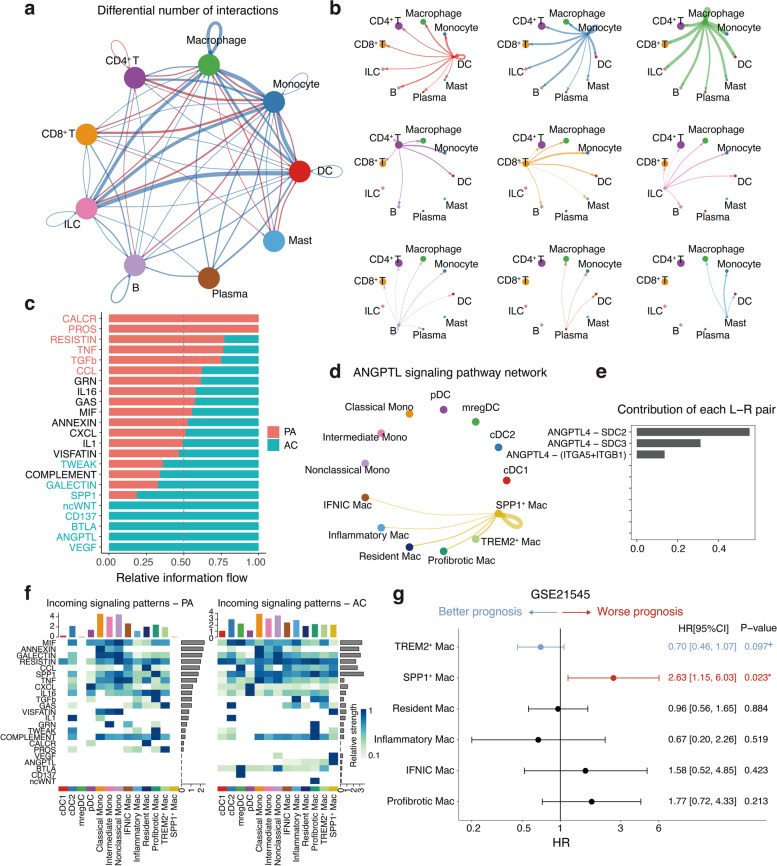
Fig. 7.
Cell–cell communications and prognostic analysis of major immune cell populations, especially macrophage subsets. a Circle plot showing the number of interactions between major immune cell types. Blue lines indicate that the displayed communication is decreased in AC, whereas red lines indicate that the displayed communication is increased in AC compared with PA. The thickness of the line is proportional to the number of unique ligand-receptor interactions, with loops representing autocrine circuits. b A detailed view of ligand and cognate receptor interaction for major immune cell types in the AC group. c Significant signaling pathways ranked based on differences in the overall information flow within the inferred networks between the PA and AC groups. Red, top pathways enriched in PA; black, equally enriched in PA and AC; green, enriched in AC. d The inferred ANGPTL signaling networks. Edge width represents the communication probability. e Relative contribution of each ligand-receptor pair to the overall communication network of ANGPTL signaling pathway. f Comparison of incoming signaling patterns of cells between the PA and AC groups. The colour is proportional to the contribution score computed from pattern recognition analysis. A higher score implies that the signaling pathway is more enriched in the corresponding cell group. g The correlation between estimated subpopulations and ischemic event (IE)–free survival in patients undergoing endarterectomy (n = 125). P-value was evaluated by the Cox proportional hazards model with 95% CI. P ≤ 0.05 were considered statistically significant in prognosis, whereas p > 0.05 and ≤ 0.1 were considered marginally significant in prognosis and represented as +

