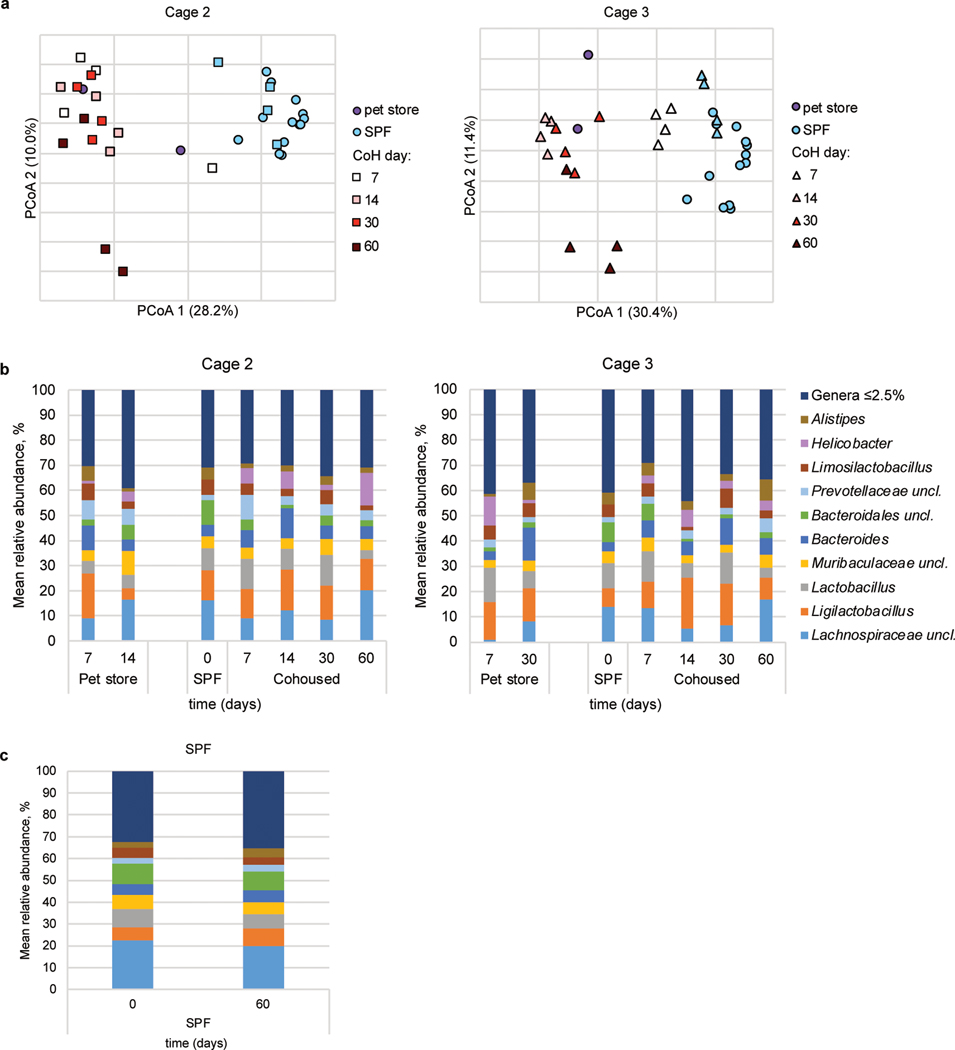
Extended Data Fig. 6. Fecal microbiota analysis.
a, Principal coordinates analysis (PCoA) of Bray-Curtis distances of mouse fecal samples from cohoused Cages 2 and 3 (Cage 1 PCoA in Figure 5b). SPF samples represented by circles are control SPF mice used in analysis of all cages and SPF samples represented by the symbols used for cohoused mice in each graph are from those same mice before cohousing. b, Distributions of abundant genera in mouse fecal samples from Cages 2 and 3. Less abundant genera accounted for less than 2.5% of the community among all samples. c, Distributions of abundant genera in mouse fecal samples from SPF control mice collected on day 0 of cohousing and 60 days later. Less abundant genera accounted for less than 2.5% of the community among all samples.

