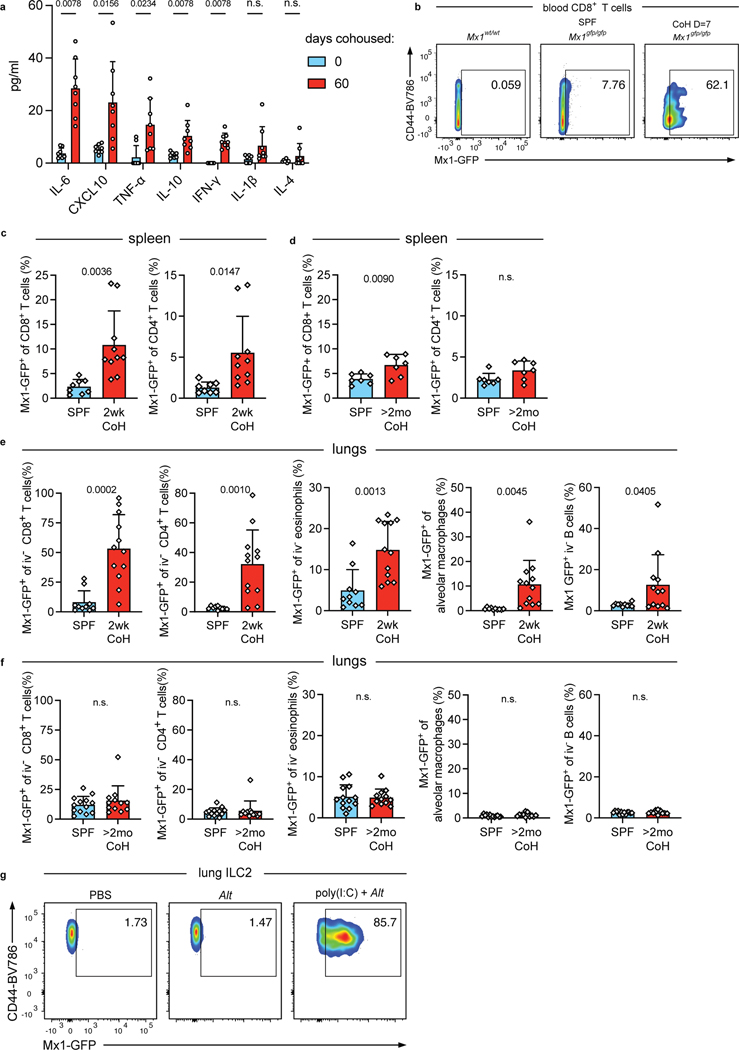
Extended Data Fig. 7. Serum cytokines and Mx1-GFP expression in cohoused mice.
a, Serum cytokine and chemokine levels of B6 mice days 0 and 60 after cohousing with a pet store mouse, (n = 8). These are from the same data in Figure 5d. Bar graphs show mean +SD. P values were determined with a two-tailed Wilcoxon matched-pairs signed rank test; n.s. p ≥ 0.05. b, Representative flow plots of Mx1-GFP expression in blood CD8+ T cells from wild-type B6 and Mx1gfp mice either housed in SPF conditions or after seven days of cohousing. Numbers in plots represent percent of cells in the gate. c-d, Percent Mx1-GFP+ of the indicated cell populations in the spleens of (c) 2wk or (d) >2mo CoH mice or age-matched controls. . e-f, Percent Mx1-GFP+ of the indicated cell populations in the lungs of (e) 2wk or (f) >2mo CoH mice or age-matched controls. c-f, Bar graphs show mean +SD. Each symbol represents a mouse. P values were determined with a Student’s t-test (two-tailed). When groups had unequal variance the t-test was conducted with Welch’s correction; n.s. p ≥ 0.05. g, Representative flow plots of Mx1-GFP expression in lung ILC2 from wild-type Mx1gfp mice 24 hours after intranasal treatment with PBS or Alt, with the indicated group treated with intranasal poly(I:C) 24 hours before Alt treatment. Numbers in plots represent percent of cells in the gate. Source Data contains exact P-values and group sizes.

