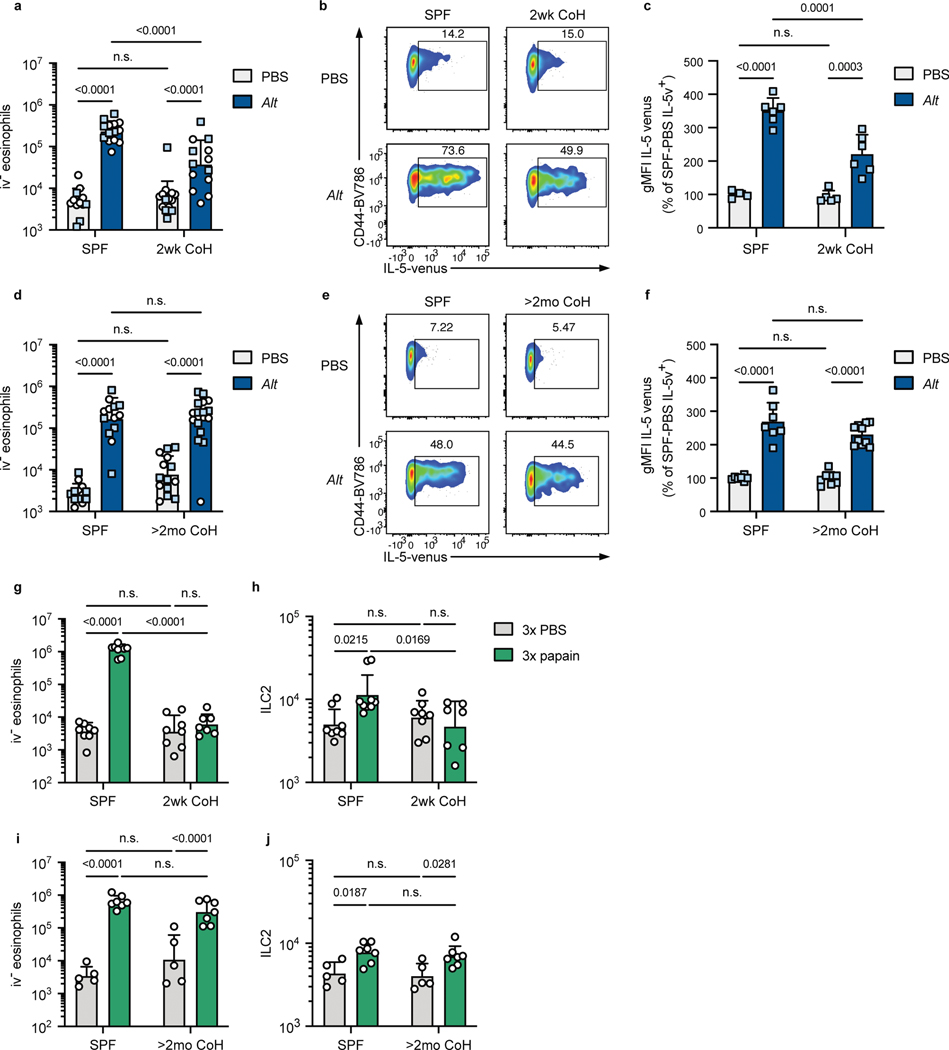
Fig. 2. Mice cohoused for two weeks with pet store mice have inhibited eosinophil and ILC2 responses to intranasal A. alternata and papain treatment.
a-f, Mice were treated once with intranasal phosphate buffered saline (PBS) or A. alternata extract in PBS (Alt) and analyzed 24 hours later. Mice were B6 (white circles) or B6xBALB/c IL-5WT/venus (IL-5v F1, light blue squares). Mice were cohoused with pet store mice for approximately two weeks (2wk CoH, a-c) or at least two months (>2mo CoH, d-f), or were age-matched specific pathogen free (SPF) mice. a, d, Number of eosinophils in the lungs and airways (CD45 i.v.−) 24 hours after intranasal treatment. b-c and e-f, IL-5 venus expression within lung ILC2 of IL-5v F1 SPF and 2wk CoH mice 24 hours after PBS or Alt treatment. b, e, Representative flow plots of IL-5 expression in lung ILC2. Numbers in plots represent percent of cells in the gate. c, f, IL-5 venus gMFI of IL-5 venus+ lung ILC2. g-j, Mice were treated with intranasal PBS or papain every other day three times and analyzed 24 hours after the last treatment. g, i, Number of lung CD45 i.v.− eosinophils in 2wk (g) or >2mo (i) CoH B6 mice or age-matched SPF controls. h, i, Number of lung ILC2 in two-week (h) or >2mo (j) CoH mice. a, d, g-j bar graphs show mean +SD of log-transformed values. c, f bar graphs show mean +SD, values from multiple experiments normalized to SPF PBS-treated mice set to 100. a pooled from four B6 experiments and two IL-5v F1 experiments (n = 12–14/group). b pooled from two IL-5v F1 experiments (n = 4–6/group). d pooled from three B6 experiments and four IL-5v F1 experiments (n = 13–16/group). f pooled from four IL-5v F1 experiments (n = 7–10/group). g, i, pooled from four experiments (n = 7–9/group). h, j, pooled from two experiments (n = 5–7/group). Each symbol represents a mouse. P values were determined with a 2-way ANOVA with Tukey’s multiple comparisons test; n.s. p ≥ 0.05. Source Data contains exact P-values and group sizes.

