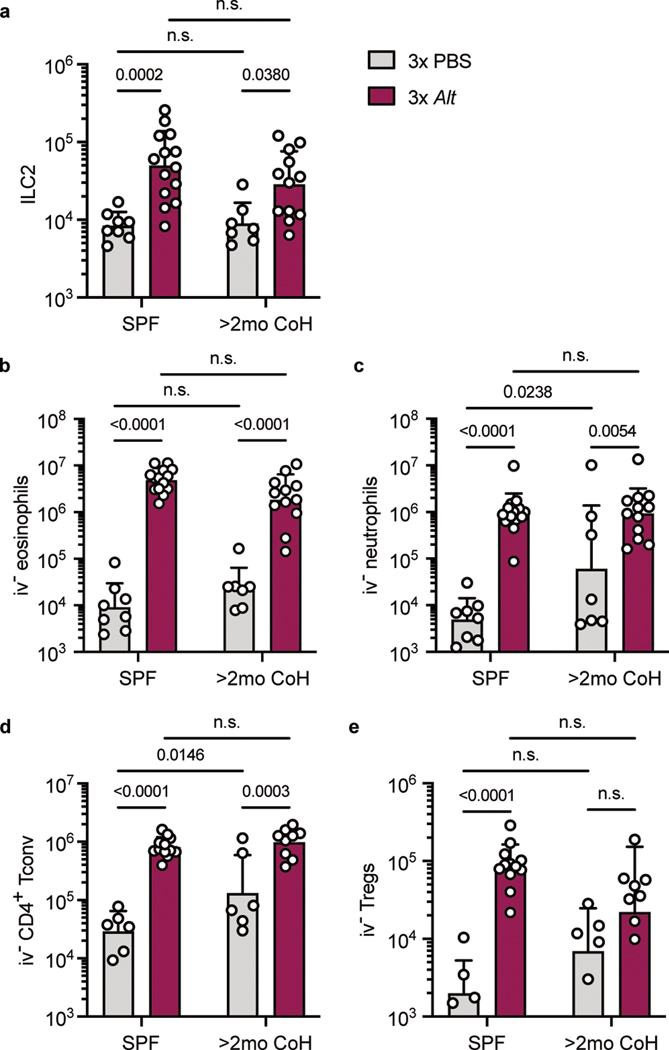
Fig. 4. Comparable immune infiltration in SPF and two-month cohoused mice after repeated A. alternata exposure.
SPF and >2mo CoH B6 mice were treated on days 0, 2, and 4 with intranasal PBS or Alt and on day 5 lungs were harvested for flow cytometric analysis. All enumerated cells were i.v. CD45−. a, ILC2, b, eosinophils, c, neutrophils, d, CD4+ conventional T cells (Foxp3−), and e, Tregs (Foxp3+ CD4+ T cells). a-c pooled from three experiments, d-e pooled from three experiments (n = 4–14/group). Bar graphs show mean +SD of log transformed values. Each symbol represents a mouse. P values were determined with two-way ANOVA with Tukey’s multiple comparisons test; n.s. p ≥ 0.05. Source Data contains exact P-values and group sizes.

