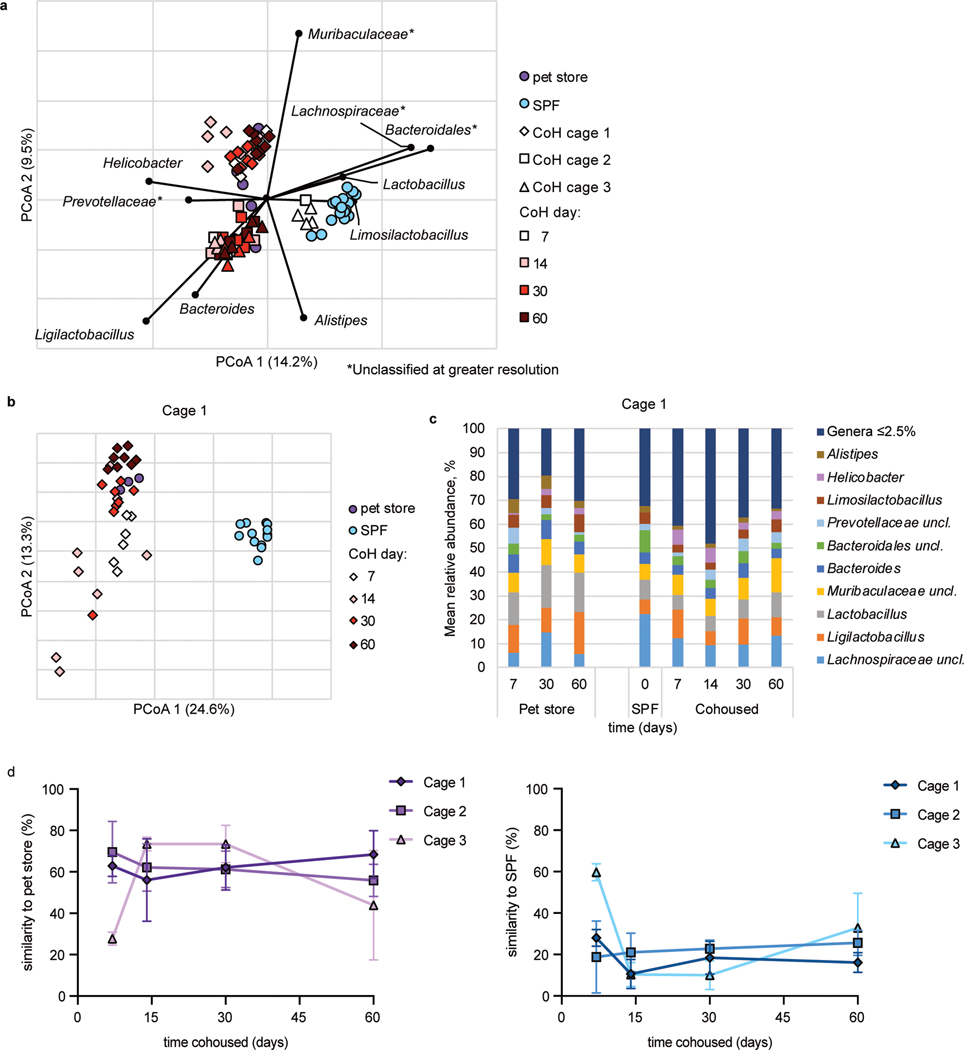
Fig. 5. Cohousing with pet store mice induces changes to fecal microbiota.
a, Principal coordinates analysis (PCoA) of Bray-Curtis distances (r2 = 0.43) of mouse fecal samples from three cohoused cages and SPF controls. The nine most abundant genera were correlated with axes position, where positioning near samples groups indicates a greater relative abundance of that genus. * indicates the bacterial group was unclassified at greater resolution. B6 mouse fecal samples were collected at the indicated time points after cohousing with pet store mice, SPF control samples were collected on days 0 and 60 of cohousing, and pet store mouse samples were collected at days 7, 14, 30, and 60. Not all mice had samples collected at all timepoints. b, PCoA from Cage 1. PCoA for cages 2 and 3 can be found in Extended Data Figure 6. c, Distributions of abundant genera in Cage 1 mouse fecal samples. Less abundant genera accounted for less than 2.5% of the community among all samples. Analysis for cages 2 and 3 can be found in Extended Data Figure 6. d, SourceTracker analysis of cohoused cages 1, 2, and 3 comparing the similarity of 16S rRNA amplicon sequencing of cohoused mice at the indicated timepoints to pet store and SPF sequencing. Symbols represent mean ±SD. c, Distributions of abundant genera in mouse fecal samples from Cages 2 and 3. Less abundant genera accounted for less than 2.5% of the community among all samples.

