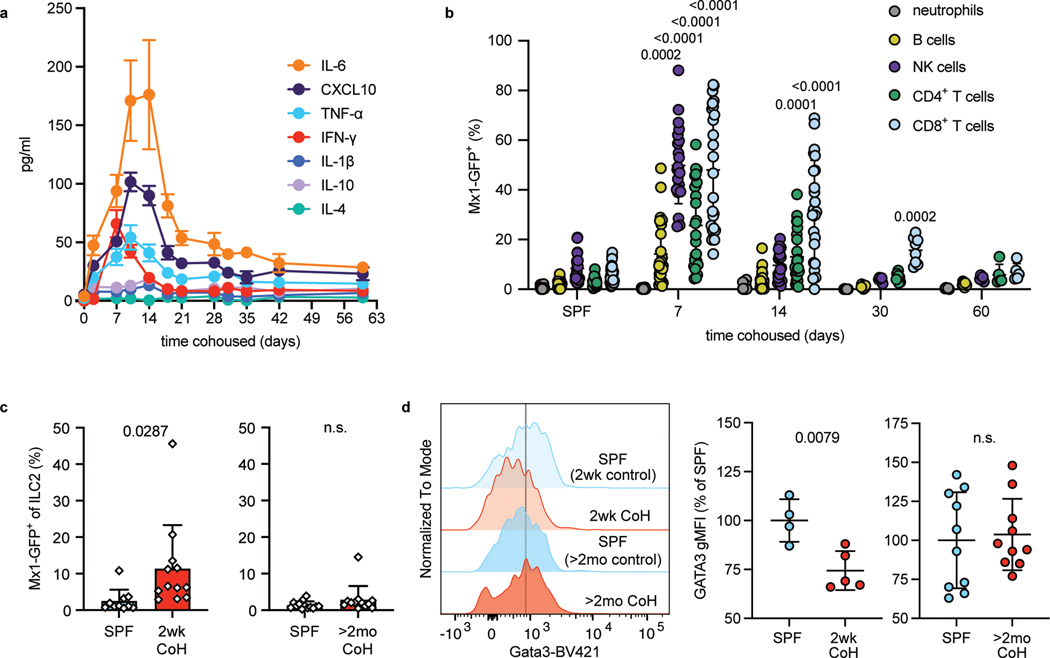
Fig. 6. Cohousing with pet store mice induces transient systemic and lung inflammation.
a, Concentration of serum cytokines and chemokines in B6 mice collected at the indicated timepoints after cohousing with a pet store mouse (n = 8). Symbols represent mean ±SD. b, Percent Mx1-GFP+ cells of the indicated cell populations in the blood of SPF or cohoused B6 Mx1gfp mice at the indicated timepoints. Bar graphs show mean +SD. P values represent the indicated group compared to the same cell population in SPF mice and were determined with a mixed-effects analysis with multiple comparisons. (n = 5–28/group). c, Percent Mx1-GFP+ in lung ILC2 two weeks or two months after cohousing and age-matched controls. 2wk CoH pooled from four experiments (n = 10–12/group).; >2mo CoH pooled from three experiments (n = 12–13/group). Bar graphs show mean +SD. Each symbol represents a mouse. P values were determined with a Student’s t-test (two-tailed) with Welch’s correction; n.s. p ≥ 0.05. d, Representative histograms and summary data of intracellular Gata3 expression in lung ILC2 from age-matched SPF and CoH mice. gMFI normalized to SPF groups in each experiment. 2wk CoH pooled from 2 experiments (n = 4–5/group), >2mo CoH pooled from 3 experiments (n = 10/group). Bar graphs show mean +SD. Each symbol represents a mouse. P values were determined with a Student’s t-test (two-tailed); n.s. p ≥ 0.05. Source Data contains exact P-values and group sizes.

