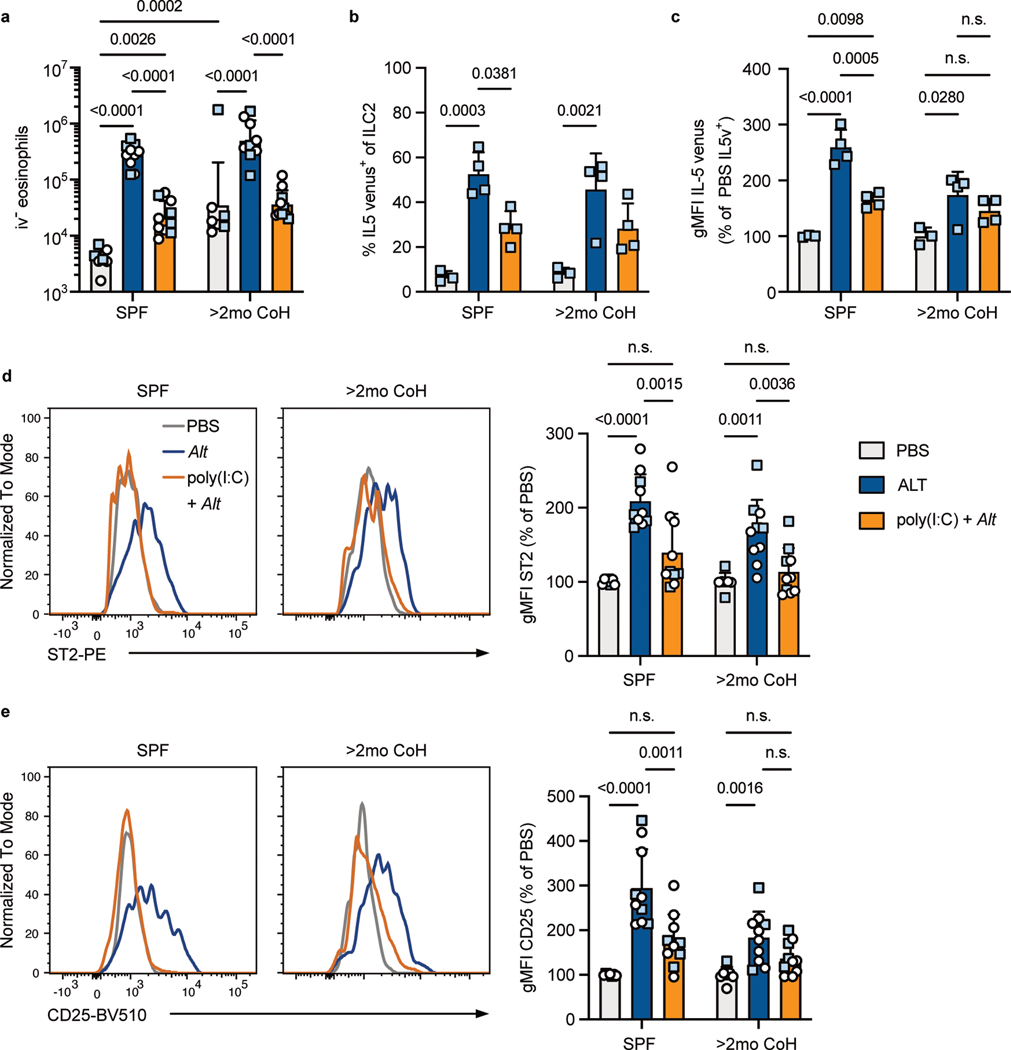
Fig. 7. Poly(I:C) suppresses ILC2 and eosinophil responses to A. alternata in SPF and two-month cohoused mice.
SPF or >2mo CoH B6 (white circles) or IL-5v F1 (light blue squares) mice were treated with intranasal poly(I:C) or left untreated 24 hours before intranasal PBS or Alt and analyzed by flow cytometry 24 hours later. a, Number of lung i.v. CD45− eosinophils. Bar graph shows mean +SD of log transformed values. b, Percent of lung ILC2 expressing IL-5 venus. c, gMFI of IL-5 venus, gated on IL-5 venus+ lung ILC2. d, Representative histograms and summary data of ST2 expression on lung ILC2. e, Representative histograms and summary data of CD25 expression on lung ILC2. a, d-e, Pooled from two B6 and two IL-5v F1 experiments (n = 7–10/group). b-c, Pooled from two IL-5v F1 experiments (n = 3–4/group). b, c, d, e, bar graphs show mean +SD. c, d, e gMFI values from multiple experiments are normalized to PBS-treated group in each housing condition. Each symbol represents a mouse. a,-b, P values were determined with two-way ANOVA with Tukey’s multiple comparisons test. Only statistically significant comparisons are indicated. c-e, P values were determined with one-way ANOVA with multiple comparisons; no symbol p ≥ 0.05. Source Data contains exact P-values and group sizes.

