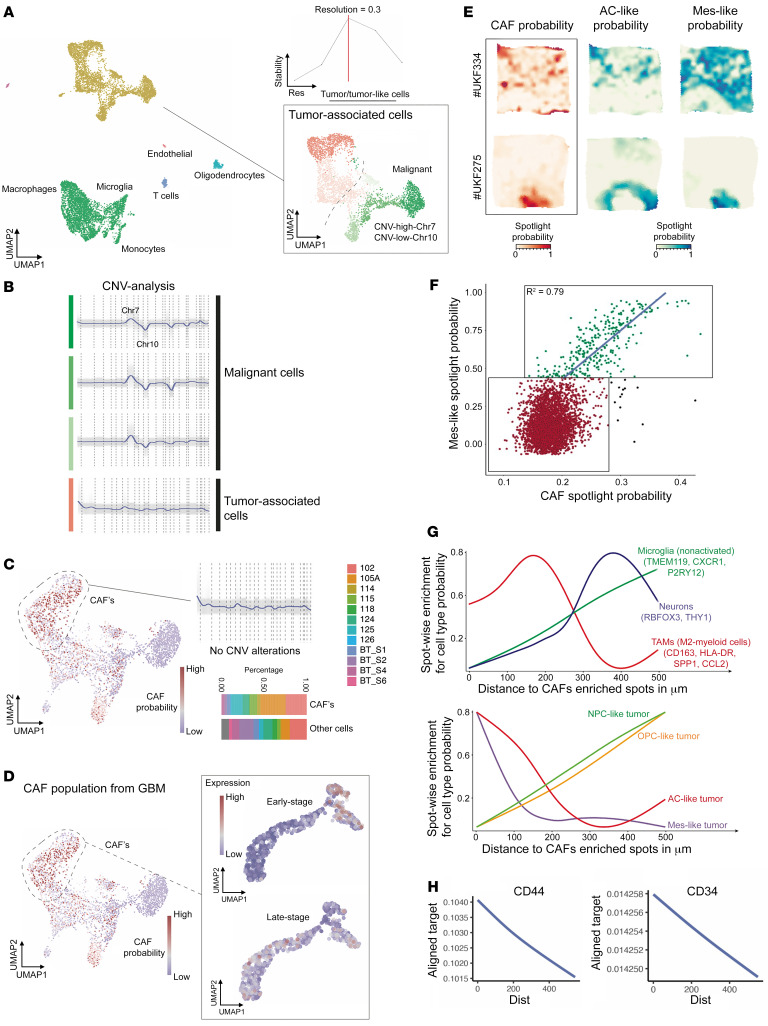
Figure 2. Identification of CAFs in GBM by scRNA-Seq of patient GBMs.
(A–D) scRNA-Seq results from 12 patient GBMs (30, 31) were analyzed using mutual nearest neighbor horizontal integration followed by SNN clustering. (A) Optimal number of clusters was determined by the cluster stability score (upper right) resulting in 18 robust cell clusters. While most stromal cells clustered away from tumor cells, some stromal cells clustered close to tumor cells. (B) Green cells were tumor cells based on CNV analysis, while red cells were stromal. (C) CAF probability scores based on exclusive gene signatures and defined exclusion criteria were computed (left side). CAFs exhibited no CNV alterations (upper right) and were identified in each of the 12 patients (lower right). (D) Presence of early versus late-stage CAF subtypes was evaluated in cells with high CAF probability scores, with late-stage CAFs predominating over early stage CAFs in these 12 patients. (E–H) Deconvolution of spatially resolved transcriptomics was performed. (E) Surface plots obtained from 6 × 6 mm tissue samples revealing that CAFs (left) spatially correlated with the MES and astrocyte-like (AC-like) GBM cell signatures (30). Two examples of low overlap (top) and high overlap (bottom) are demonstrated. (F) Spatial correlation between CAFs and mes-GBM cells was significant (P < 0.001, Pearson’s R2 = 0.79). (G and H) Line diagrams show the spatial relationship between CAFs and other cell types or states (tumor subtypes). The x axis represents the relative distance to CAFs. The y axis shows the cell type/state probability of a particular gene set or spotlight probability. The spatial distance of CAFs to different cell types or states was computed based on ranked cell-type probability. If high cell probability values are displayed at a short distance (dist) from CAFs, the likelihood of a spatial relationship is high, as occurred for (G) mes- and AC-GBM cells and M2 TAMs and (H) CD44+ GSCs and CD34+ endothelial cells.

