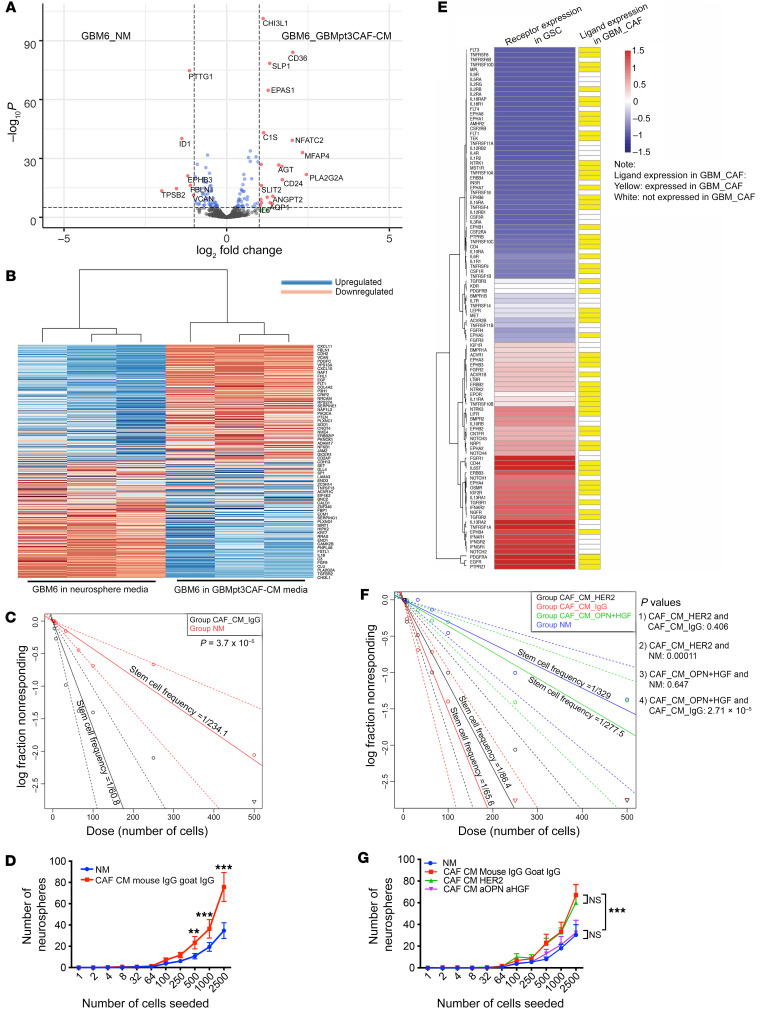
Figure 3. CAFs induce protumoral effects on GSCs.
Multiplex transcriptomic analysis using the NanoString nCounter platform revealed cancer progression genes upregulated by GBMpt3CAF CM in GBM6 GSCs. (A) Volcano plot showing significantly (P < 0.05) up- (right of rightmost vertical dashed line) and downregulated genes (left of leftmost vertical dashed line). (B) Heatmap showing significantly (P < 0.05) up- and downregulated genes. (C) Limiting dilution sphere-formation assay represented by Poisson’s distribution shows increased GSC frequency with GBM6 cells in CAF_CM (P = 3.7 × 10⁻⁵). (D) Limiting dilution sphere-formation assay showing that CAF_CM increases neurosphere formation (2,500 cells: P < 0.0001; 1,000 cells: P = 0.001; 500 cells: P < 0.0067). (E) Receptor expressions in GBMpt1CAFs and GBMpt2CAFs (Supplemental Table 3) were mapped to their cognate ligands/agonists expressed by GBM6 neurospheres (37) based on a database of 491 receptor-ligand interactions (67). Shown are cognate pairs coexpressed by GBM CAFs and GSCs for which FPKM of the ligand is greater than 0.05 and read counts of the receptor are greater than 10 (174 CAF ligands with receptors expressed by GSCs). (F) Limiting dilution sphere-formation assay represented by Poisson’s distribution shows that the increased GSC frequency in CAF_CM is mitigated by combining anti-HGF and anti-OPN (P values on graph). GSC frequency was not mitigated by HER2 antibody in CAF_CM. (G) Limiting dilution sphere-formation assay showing that induction of neurosphere formation by CAF_CM is mitigated by combining anti-HGF and anti-OPN (2,500 cells: P < 0.0001; 1,000 cells: P = 0.009; 500 cells: P = 0.04). Sphere-formation was not mitigated by anti-HER2 in CAF_CM (P = 0.7–0.8). ANOVA with post hoc Tukey’s test. For limiting dilution sphere-forming assays, log-fraction plots of the limiting dilution model fitted to the data are shown. The slope of the line is the log-active cell fraction. Dotted line shows 95% CI. Data value with zero negative response at a particular dose is represented by a downward pointing triangle. **P < 0.01; ***P < 0.001.

