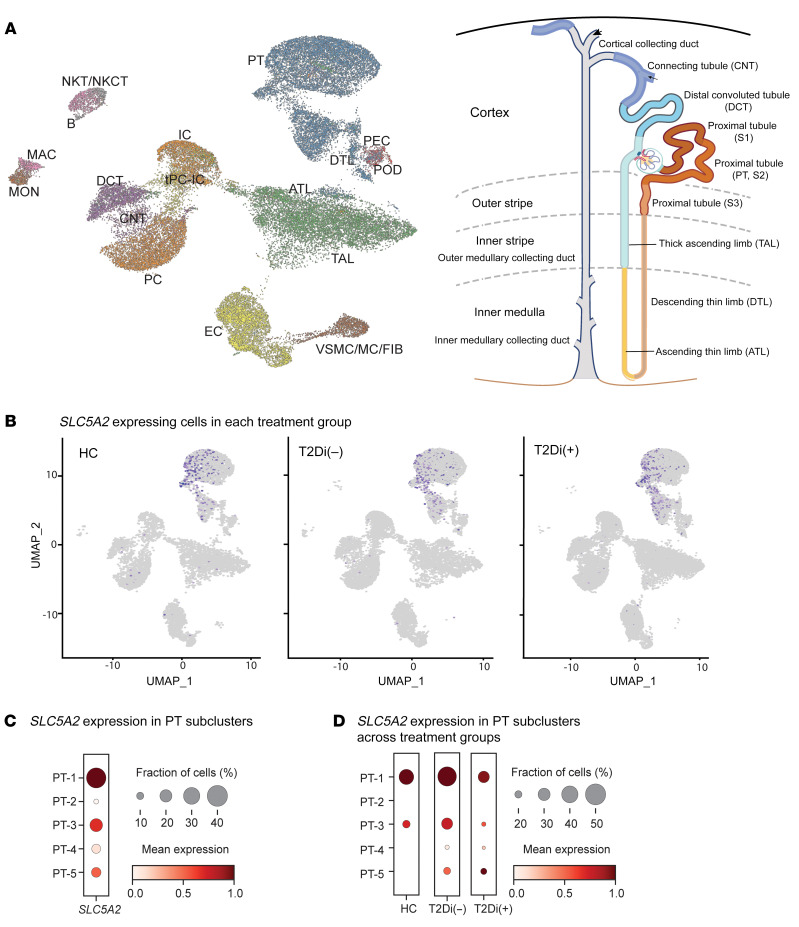
Figure 2. SLC5A2 gene expression is limited to PT clusters.
(A) UMAP projection of annotated cellular clusters from 3 groups, HCs (n = 6), T2Di (–) (n = 6), and T2Di(+) (n = 10), correspond to all major cell types in the nephron. Cluster identity and color are mapped onto the nephron schematic. (B) For all groups (HC, T2Di[–], and T2Di[+]), SLC5A2 mRNA–expressing cells (purple dots) were limited to the PT cluster. (C) Size of dots, reflecting fraction of cells (%) expressing SLC5A2 mRNA, and color intensity, indicating mean expression levels, varied across PT subclusters, with PT-1 having the highest expression and PT-2 and PT-4 having the lowest expression. (D) SLC5A2 mRNA expression varied across the 3 groups, with T2Di(+) lower than T2Di(–) across all PT subclusters. ATL, ascending thin limb; DCT, distal convoluted tubule; CNT, connecting tubule; tPC-IC, transitioning intercalated/PCs; EC, endothelial cells; vSMC/MC/Fib, vascular smooth muscle cells/mesangial cells/fibroblasts; PEC, parietal epithelial cells; POD, podocytes; MAC, macrophages; MON, monocytes; B, B cells; NKT/NKCT, natural killer T cells/natural killer cells with T cells; PT, proximal tubule; DTL, descending thin limb; TAL, thick ascending limb; IC, intercalated cells; PC, principal cells.

