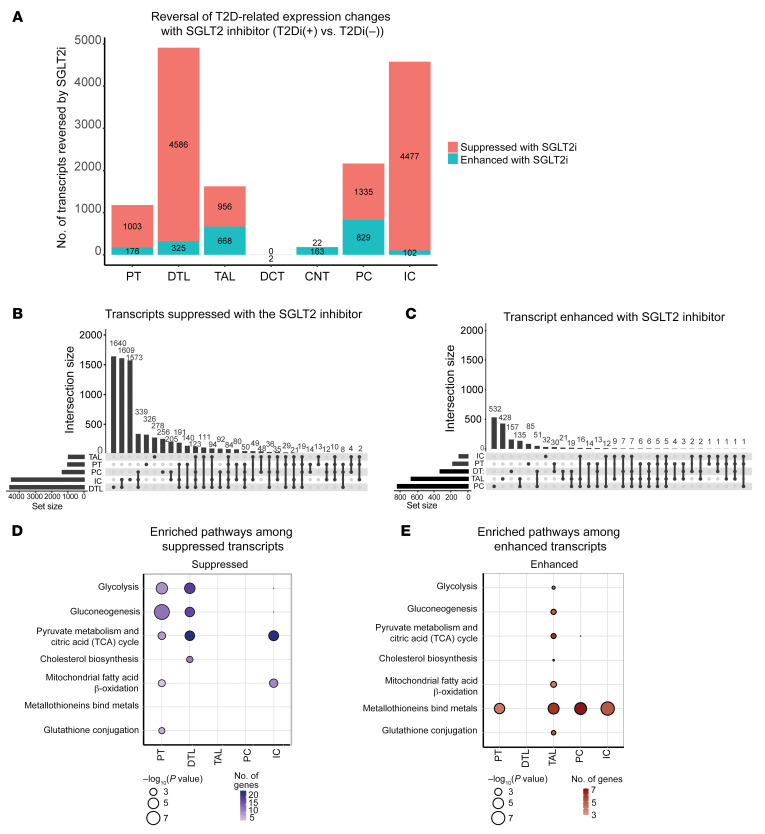
Figure 3. SGLT2 inhibition altered transcript expression in the majority of tubular cell segments.
(A) Plot of the number of transcripts reversed, suppressed, or enhanced with SGLT2i shows that the majority of transcripts altered with SGLT2i were in distal nephron segments. The fold changes (log2FC) were calculated between 2 comparisons: T2Di(–) versus HCs and T2Di(+) versus T2Di(–). Transcripts were required to pass FDR-adjusted P values of less than 0.05 in T2Di(–) versus HCs and in T2Di(+) versus T2Di(–) to be considered reversed. (B) Upset plots indicate most transcripts suppressed with SGLT2i were in DTL. DTL and IC shared the greatest number of transcripts. (C) Most unique transcripts enhanced with SGLT2i were in PC, TAL, and DTL. PC and TAL had the greatest number of overlapping transcripts (n = 135). Using the Reactome database and Fisher’s exact test, (D) central metabolic pathways in PT, DTL, and IC were suppressed and (E) all central metabolic processes were enhanced in TAL. Metallothioneins were enhanced across all segments, except DTL.

