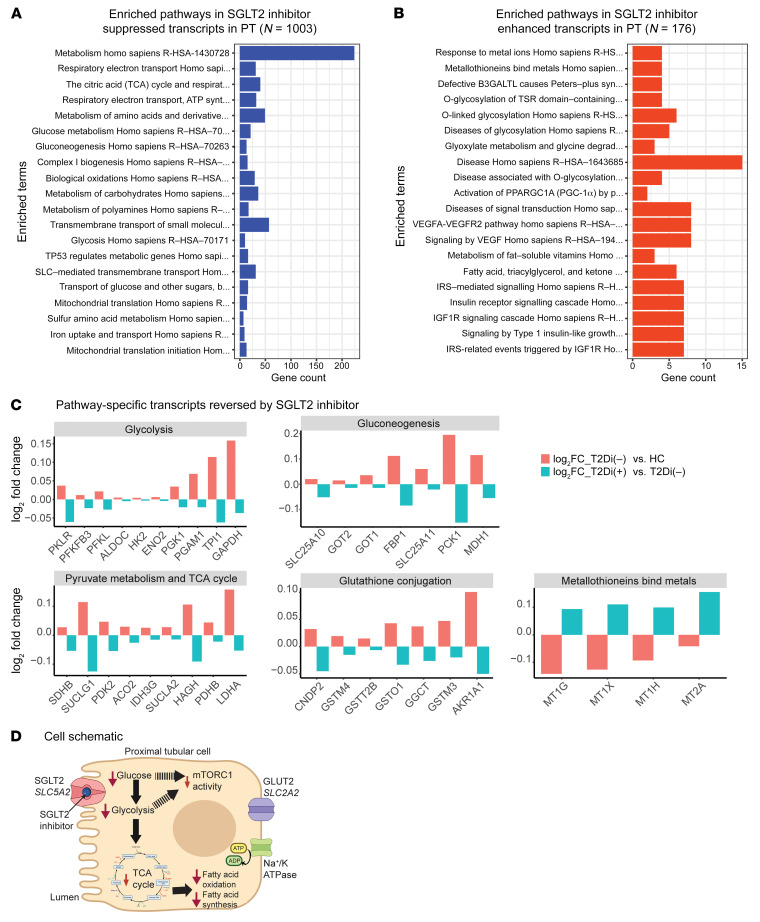
Figure 4. Suppression of central metabolic pathways with SGLT2 inhibition in PT.
(A) Enrichment analysis using Reactome data of suppressed transcripts with SGLT2 inhibition showing metabolism has greatest number of altered transcripts (n > 200). (B) Pathway enrichment analysis using Reactome database of enhanced transcripts with SGLT2 inhibition. A pathway was considered significant if its P value was less than 0.05 and included at least 5 transcripts reversed by SGLT2i. (C) Bar plots showing transcript-level alterations (log2FC) when comparing T2Di(–) to HCs (pink) and T2Di(+) to T2Di(–) (blue). (D) Schematic summarizing the transcriptional changes in PT cells. SGLT2i impairs uptake of sodium and glucose into PT cells via SLC5A2, leading to decreased expression of glycolytic and TCA cycle transcripts. Decreased glucose uptake and glycolysis may decrease mTORC1 activity.

