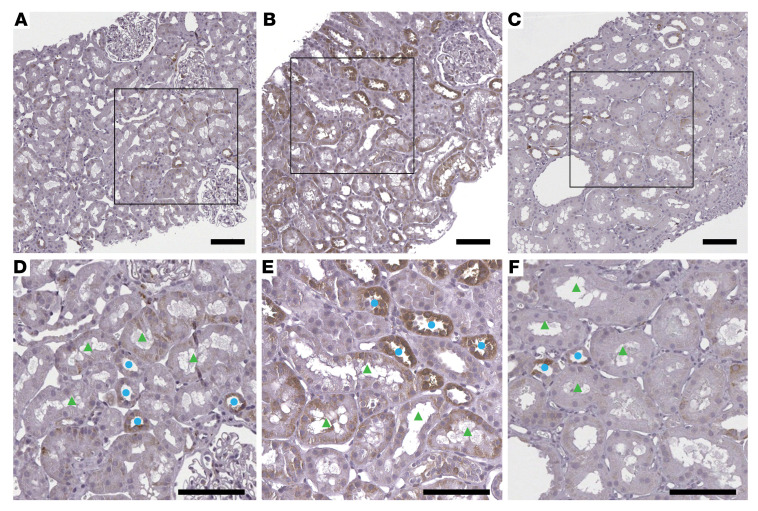
Figure 8. Phospho-S6 ribosomal protein immunohistochemistry.
Representative images are shown from kidney biopsy sections immunohistochemically stained for phospho-S6 ribosomal protein from (A) HCs with average staining intensity for PT = 0.9 ( ± 0.4) and DT = 1.1( ± 0.5), (B) T2Di(–) with average staining intensity for PT = 1.4 ( ± 0.4) and DT = 2.1( ± 0.6), and (C) T2Di(+) with average staining intensity for PT = 0.8 ( ± 0.8) and DT = 1.1( ± 0.7), n = 4 in each group. Glass slides were scanned to whole slide images at ×40 magnification. Scale bars: 100 μm. Bottom panels D–F are closer views from square areas from panels A–C, respectively. Staining intensity was increased in both proximal (green triangles) and distal (blue circles) tubules in (E) T2Di(–) versus (D) HCs and was decreased in (F) T2Di(+). The average scores of the staining intensity were calculated from measurements by 2 independent pathologists.

