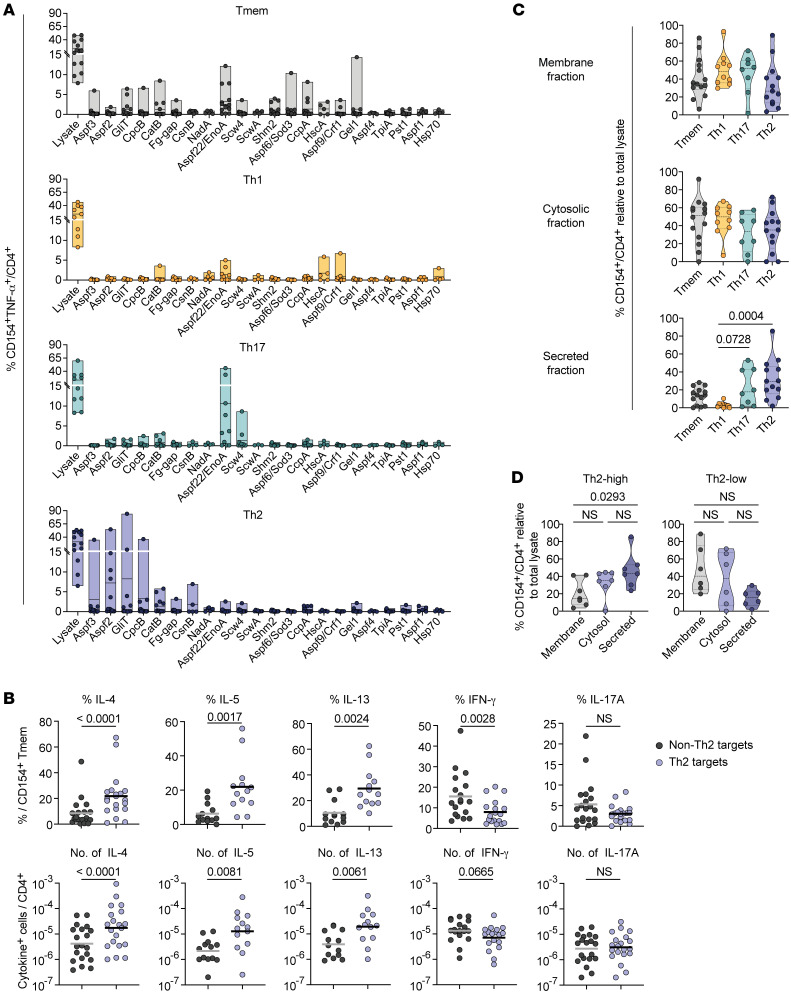
Figure 4. A. fumigatus–reactive Th cell subsets recognize different protein targets.
(A) PBMCs from pwCF (n = 8–14) were stimulated with whole A. fumigatus lysate, and reactive CD154+ Tmem, Th1 (IFN-γ+), Th17 (IL-17A+), or Th2 (CRTH2+) cells were FACS sorted, expanded, and restimulated with a panel of single A. fumigatus proteins. Reactivity is indicated as the percentage of CD154+TNF-α+ within CD4+ T cells. (B) Th2 target proteins (Aspf2, Aspf3, CpcB, CatB, Fg-gap, GliT) and non-Th2 target proteins (Scw4, Aspf22, Pst1, Shm2, CcpA, TpiA, Crf1, Sod3) were pooled and used for ex vivo stimulation of PBMCs from A. fumigatus–sensitized pwCF. Relative cytokine production within reactive CD154+ Tmem cells (upper plots) and absolute frequencies of cytokine producers within CD4+ T cells (lower plots) are shown (IL-4, IFN-γ, IL-17A, n = 20; IL-5, IL-13, n = 13). (C) A. fumigatus–reactive T cell lines were generated as in A and restimulated with different A. fumigatus antigen extracts in the presence of autologous FastDCs derived from blood monocytes. Reactivity in relation to restimulation with the initially used total A. fumigatus lysate is shown. (D) Reactivity of expanded CD154+ Tmem cells from Th2-high (n = 7) or Th2-low (n = 6) patients to the different A. fumigatus protein fractions. Each symbol in A–D represents 1 donor; horizontal lines indicate the mean in upper plots and the geometric mean in lower plots of B; truncated violin plots with the quartiles and range are shown in C and D. Statistical differences were determined by 2-tailed, paired Wilcoxon rank test in B. and by Kruskal-Wallis test with Dunn’s post hoc test in C and D.

