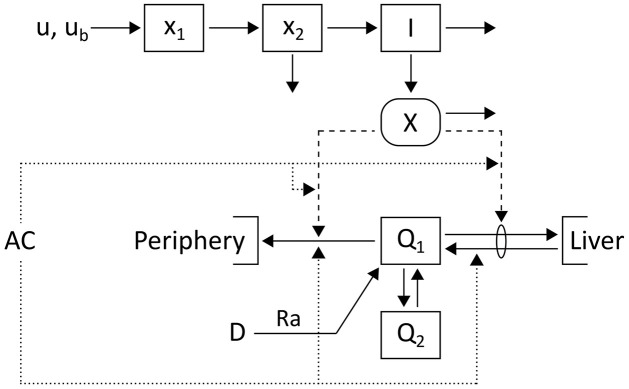
Fig 1. Schematic of the glucose-insulin model.
Glucose, Q1, and insulin, I, dynamics are described using a two-compartment model [33]. Extensions capture plasma insulin kinetics after subcutaneous injection u with basal insulin infusion rate ub [34] and glucose appearance with rate Ra after a meal D [35]. PA is measured via accelerometer counts AC and leads to changes in glucose metabolism indicated by dotted lines.

