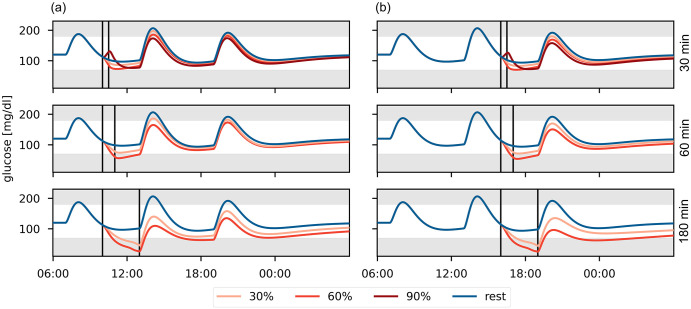
Fig 4. Comparison of glucose trajectories for different PA scenarios in a full-day simulation.
PA is performed at 30%, 60% and 90% for 30, 60 and 180 minutes (a) in the morning, or (b) in the afternoon. The PA session is marked by vertical lines. Meals are eaten at 7:00, 13:00 and 19:00 containing 40g, 60g and 50g CHO, respectively.

