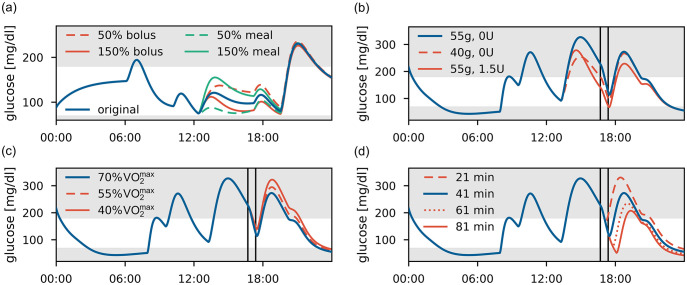
Fig 6. Replay simulations.
(a) Participant #3, day 1. Variations in meal size and insulin dose at lunch to 50% and 150% of their original size. (b)-(d) Participant #5, day 2, with a PA session marked by vertical lines. The original glucose trajectory is shown in blue. (b) Meal or bolus adjustment for pre-PA meal. (c) Alterations in PA intensity from 70% to 55% and 40% . (d) Alterations in PA duration from 41 min to 21, 61 and 81 min, with the post-exercise meal following directly after the session.

