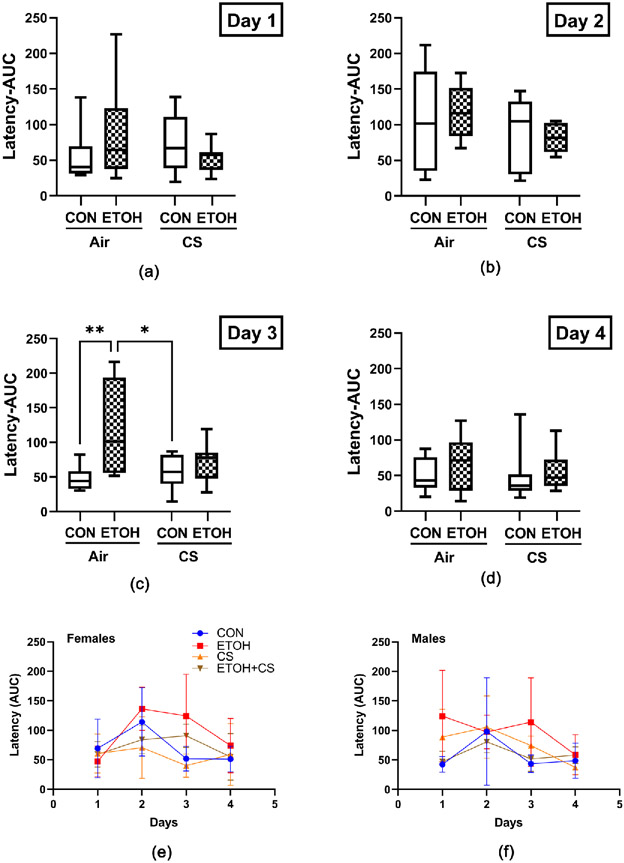
Figure 2.
Morris Water Maze (MWM): A 4-way experimental model generated with male and female Long Evans rats was grouped as follows: CON: control diet + air exposure; ETOH: ethanol diet + air exposure; CS: control diet + CS exposure; and ETOH + CS: ethanol diet + CS exposure. MWM test was performed over 4 days (Monday-Thursday) with 3 trials per day after 8 weeks of ethanol ± CS exposures. Data were analyzed by calculating the area under the curve (AUC) for latencies to locate the platform on (a) Day 1; (b) Day 2; (c) Day 3; and (d) Day 4. The box and whisker plots depict the mean and 95% confidence intervals of the parameters. Inter-group comparisons were made by two-way ANOVA with the Tukey post hoc tests (*P < 0.05; **P < 0.01).

